


INTRODUCTION
Hypodensity on non-contrast computed tomography (CT) is typically observed 12 to 24 hr following acute cerebral infarctions3). However, in some cases, cerebral infarctions may briefly disappear on imaging 2 to 3 weeks after onset. Becker et al.2) first described this phenomenon using the term “fogging effect” in 1979 and similar occurrences have also been reported in magnetic resonance (MR) imaging (MRI). It is generally reported at T2 image, but can also be observed in diffusion-weighted image (DWI)1,2).
Studies have reported the occurrence of the fogging effect to be anywhere between 10% to 54% of reported cerebral infarction cases4,6,8,9). This wide range of prevalence rates may be partly attributed to misinterpretation of the lack of radiological findings by radiologists or physicians despite clinically suspected cerebral infarction. Therefore, it is necessary to understand the fogging effect to facilitate accurate interpretation of CT or MRI data and appropriate treatment. Herein, we report three cases illustrative of the fogging effect on CT and MRI scans obtained during the subacute stage of cerebral infarction.
CASE REPORT
Case 1
A 12-year-old boy presented to the emergency department at our institution with a loss of consciousness after a pedestrian accident. The patient’s Glasgow Coma Scale score at this time was 3 points.
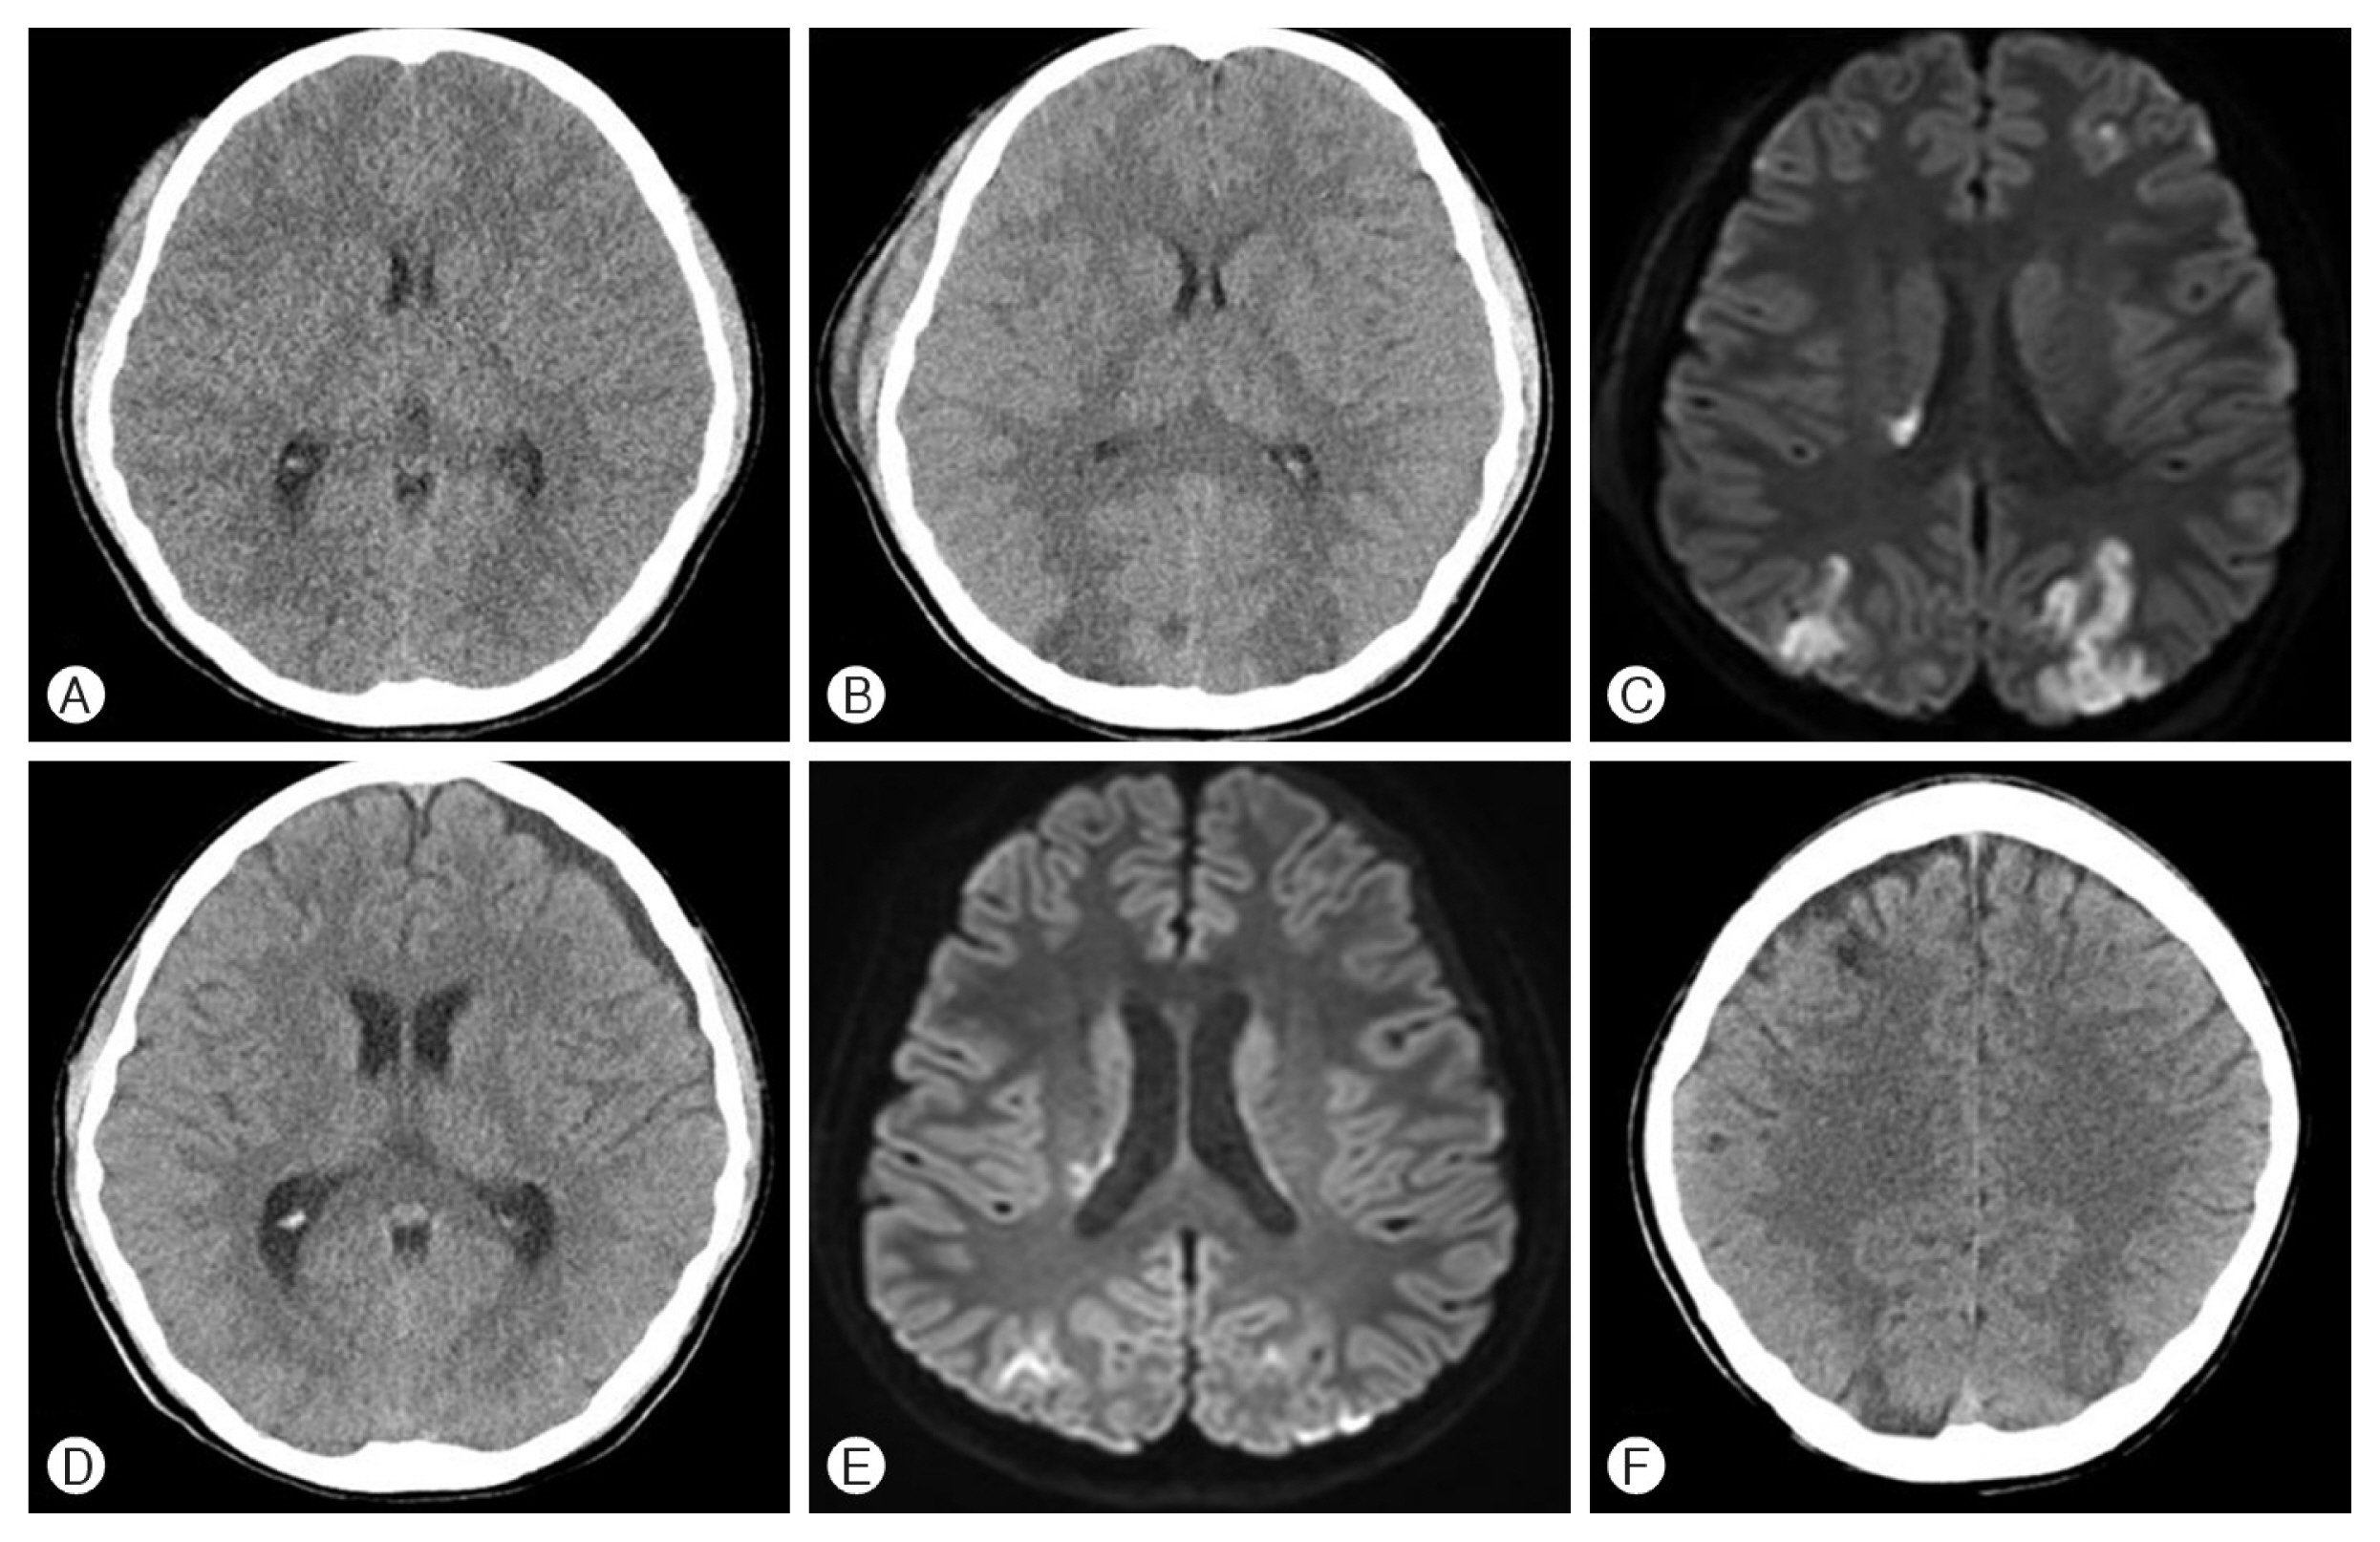
No evidence of intracranial hemorrhage or cerebral infarction was detected on the initial non-contrast head CT (Fig. 1A). On the second day of hospitalization, the patient’s state of consciousness progressed to a stupor and the follow-up non-contrast head CT demonstrated hypodensity in both occipital lobes (Fig. 1B). A DWI obtained on the same day demonstrated high signal intensity corresponding to the head CT findings (Fig. 1C). By day 18 post-injury, the patient’s consciousness improved to a drowsy state. Isodensity was noted on a follow-up non-contrast head CT scan in the previously hypodense area (Fig. 1D). Similarly, repeat DWI did not demonstrate any high signal intensity (Fig. 1E). By day 40, the hypodensity was redemonstrated (Fig. 1F). The patient was subsequently transferred to another hospital for rehabilitation and remained in a drowsy state of consciousness at discharge.
Case 2
A 61-year-old woman with a history of hypertension and hyperlipidemia presented to the emergency department with a sudden onset headache. Though alert at the visit, the patient developed a seizure for which she was sedated.
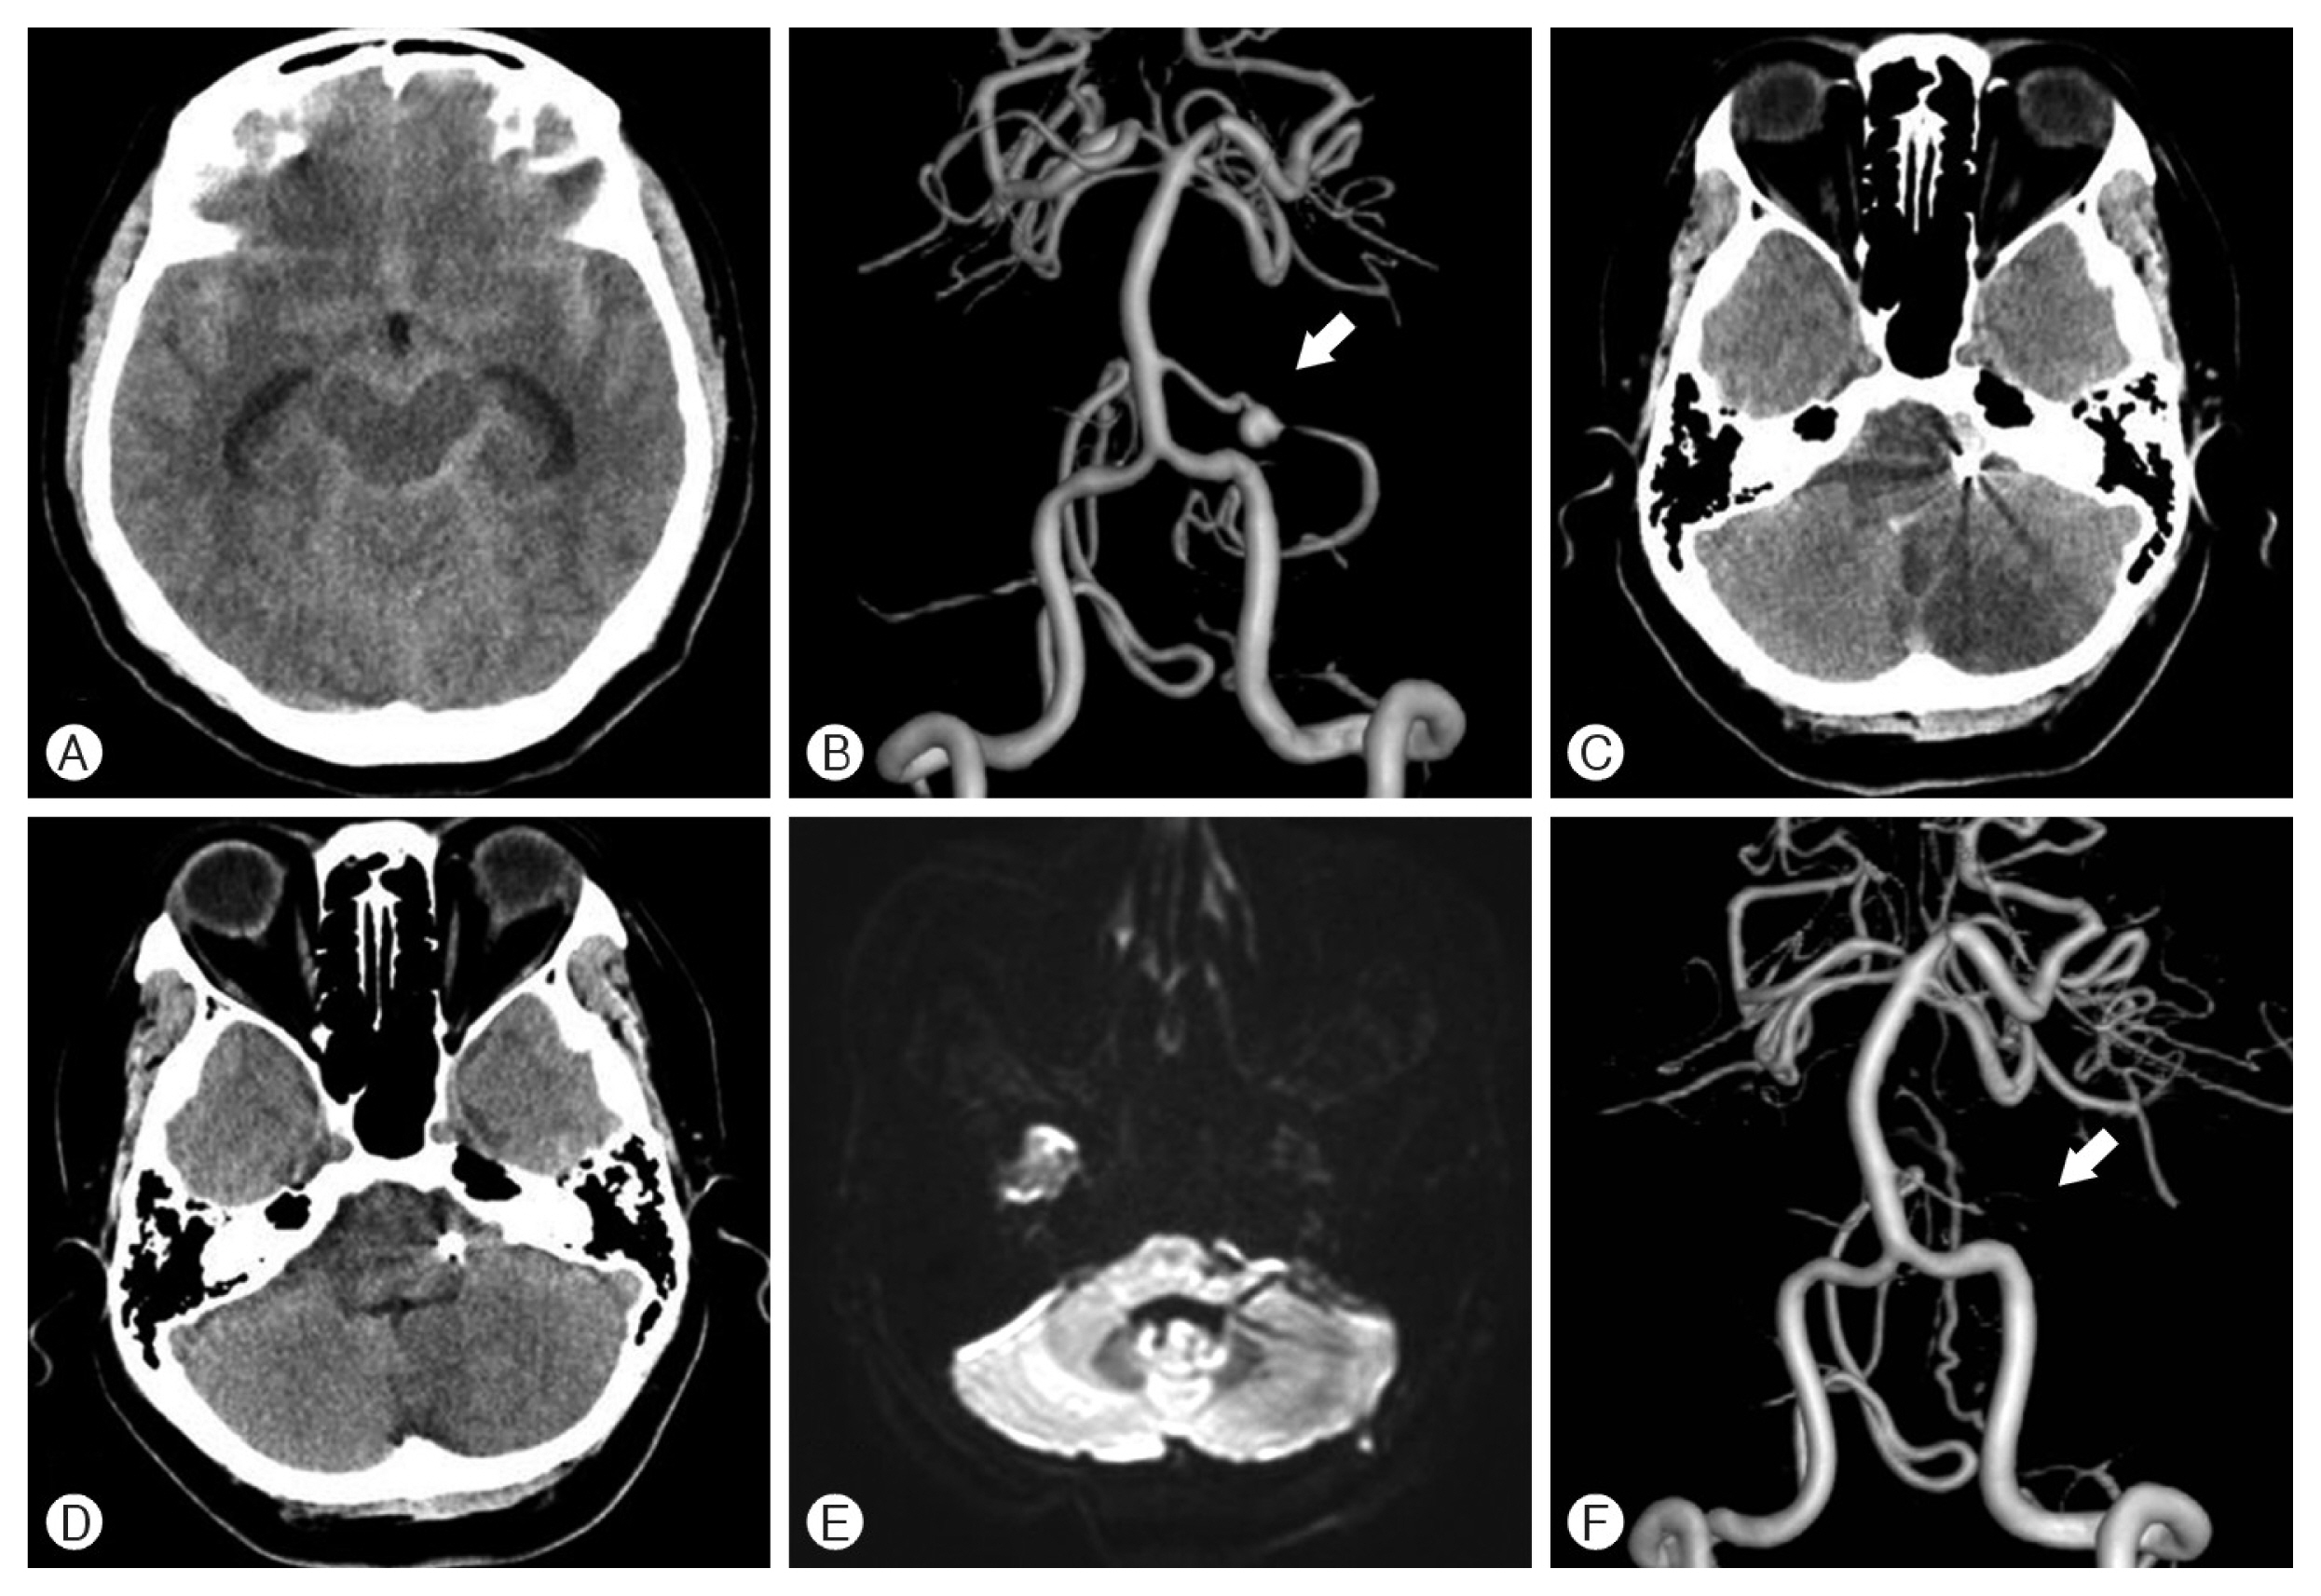
The initial non-contrast head CT scan revealed a subarachnoid hemorrhage and a subsequent cerebral digital subtraction angiography (DSA) indicated a saccular aneurysm of the left anterior inferior cerebellar artery (AICA) (Fig. 2A, B). An emergency endovascular internal trapping of the aneurysm was performed using coils, resulting in distal AICA flow blockage.
The hypodensity lesion was observed on a non-contrast head CT in the left AICA territory of cerebellar cortex 4 days post-admission (Fig. 2C). By day 14, these changes were not demonstrated (Fig. 2D). Similar isointense findings were noted on a DWI conducted on day 20 of hospitalization (Fig. 2E). The patient’s consciousness and symptoms, including the headache, improved and she was discharged without any complications. A year later, distal flow of the AICA blockage was demonstrated again via a DSA exam (Fig. 2F).
Case 3
A 25-year-old woman who presented with mental deterioration and left-sided weakness was admitted to the emergency room in our hospital. Initial non-contrast head CT and DWI scans revealed a cerebral infarction in the right temporoparietal lobe (Fig. 3A, B) and subsequent MR angiography findings indicated moyamoya disease. The patient underwent conservative management of cerebral infarction. DWI conducted on day 10 following hospitalization showed isosignal intensity in the right temporoparietal region compared to the DWI taken at admission (Fig. 3C). DWI performed in the outpatient department 4 months after discharge demonstrated low signal intensity in the right temporoparietal lobe (Fig. 3D).
DISCUSSION
Hypodensity on non-contrast CT is typically observed 12 to 24 hr following acute cerebral infarctions3). However, in rare cases, cerebral infarctions may briefly disappear on imaging 2 to 3 weeks after onset, at the subacute stage of the disease process. Becker et al.2) first described this phenomenon using the term “fogging effect” in 1979 and similar occurrences have also been reported in MRI. It is generally reported at T2 image, but can also be observed in DWI1,2).
Becker et al.2) correlated CT findings to the pathological findings of Spatz’s classification7). According to this, the fogging effect appears in the resorption stage2,7) and is thought to be the result of lipid-laden macrophage invasion, proliferation of capillaries, extravasation of blood cells, and decrease in bulk water in the infarcted area. Since water levels and cellularity in the infarct area can return to near-normal levels in the subacute stage of cerebral infarction, the fogging effect occurs most frequently during this period2,5,7).
When retrospectively reviewed, the three cases reported here conspicuously demonstrate the fogging effect on CT images and DWI. As commonly occurs in clinical practice, we did not initially consider the fogging effect due to lack of awareness, and instead assumed that the disappearance of findings evidenced improvements, not only in terms of imaging but also clinically.
Therefore, it is important to be aware of the possibility of unusual changes in these imaging studies, and care should be taken not to unnecessarily discontinue or alter treatments due to temporary improvements visible on the images. In addition, continued research on imaging methods and interpretations of cerebral infarction in subacute stage might be needed.
CONCLUSION
In summary, the fogging effect is an unusual presentation in an imaging study that can lead to incorrect judgment in diagnosis and treatment in cerebral infarction patients during the subacute stage. Therefore, possible unusual changes in these imaging studies must be aware for continuous and proper treatment of patients.