Outcome and Prognostic Factors in Patients with Chronic Subdural Hematoma Classified According to the Initial Glasgow Coma Scale Score
Article information
Abstract
Objective
The purpose of this study was to identify the risk and prognostic factors correlated with mild to severe symptoms in patients with chronic subdural hematoma (CSDH) who underwent burr hole drainage.
Methods
A total of 256 patients who had undergone burr hole drainage for CSDH were enrolled in this study. According to their Glasgow Coma Scale (GCS) score at admission, patients were divided into a “severe” (GCS<13) and a “mild” (13≤GCS) group. Patient outcome was assessed at discharge and at a three-month follow-up using the Glasgow Outcome Scale (GOS).
Results
Of the 256 patients, 36 (14.1%) were included in the “severe” group, and 220 (85.9%) in the “mild” group. In patients with severe symptoms, old age (p=0.040), end-stage renal disease (ESRD) (p=0.038), alcoholism (p=0.032), a low initial GCS score (p<0.001), and low and mixed hematoma density (p=0.033) were more frequently observed. According to the GOS scores at discharge, more patients in the “severe” group also had ESRD (p=0.018). For the “mild” group, GOS scores indicated significant correlations with GCS score at admission (p<0.001), irrigation (p=0.037), and age (p=0.004). The GOS score at the three-month follow-up was correlated with only GCS at admission (p=0.002) in patients with mild symptoms.
Conclusion
The outcome of patients with mild CSDH who underwent burr hold drainage was correlated with age, initial GCS score, and irrigation. The outcome of patients with severe CSDH was correlated only with ESRD.
INTRODUCTION
Chronic subdural hematoma (CSDH) is one of the most common types of intracranial hemorrhage, and is caused by a tear in the bridging vein due to minor head trauma9). In addition, other causes of CSDH, including coagulopathy, brain surgery, and brain hypotension, are also well known2,8,19). Most patients with CSDH experience mild symptoms, such as headache. For treatment, patients with CSDH undergo burr hole drainage, which is a simple surgery requiring a short hospital stay10). However, it is common for patients to also experience severe symptoms, such as unconsciousness, and to have a poor prognosis6). Therefore, it is inaccurate to consider CSDH as a mild and simple disease.
In CSDH, old age, antiplatelet medication, anticoagulant medication, diabetes mellitus (DM), end-stage renal disease (ESRD), coagulopathy, Glasgow Coma Scale (GCS) score, hematoma thickness, and bilaterality of the hematoma are all well-known prognostic factors correlated with the outcome of burr hole drainage4,11,17,18,20). However, it is not known whether patients with severe symptoms have the same outcome and prognostic factors as patients with mild symptoms.
Therefore, the purpose of this study was to identify the risk and prognostic factors correlated with severe symptoms in patients with CSDH who underwent burr hole drainage, and to compare these factors with those in patients with mild symptoms.
MATERIALS AND METHODS
1. Patients
This retrospective study was approved by the institutional review board and the requirement for informed consent was waived. Three hundred and one patients with CSDH were admitted and treated in a single center. Patients who were hospitalized and underwent burr hole drainage for the treatment of symptoms caused by CSDH were included. Patients who were treated without hospitalization and burr hole drainage were excluded. In addition, patients who required repeat operation, due to recurrence, were excluded as each surgeon had a different perspective on the recurrence or the need for re-operation. A total of 256 patients were enrolled in this study. At admission, patients were divided into two groups: a “severe patient” group (GCS<13) and a “mild patient” group (13≤GCS)14).
2. Clinical Data
Patient clinical data were obtained via a retrospective chart review. Clinical data included information regarding age, sex, DM, hypertension (HTN), ESRD, history of head injury, alcoholism, use of anticoagulant and antiplatelet agents, and GCS score. History of DM or HTN was defined as patients who were prescribed medication for either condition. ESRD was defined as kidney failure (glomerular filtration rate <15mL/min/1.73m2) requiring permanent renal replacement therapy. History of head injury was defined as the occurrence of a head injury within three months prior to hospital admission. Alcoholism was defined as the consumption of more than 14 standard portions of alcohol per week or four per day7). The initial GCS score was measured at admission.
3. Radiologic Findings
Patients who complained of symptoms such as headache, general weakness, or neurological deficits were examined for CSDH using computerized tomography (CT) scans of the brain. When CSDH was observed on a brain CT scan, several parameters were assessed and documented. The location of the hematoma was classified as unilateral or bilateral, hematoma thickness was measured based on the maximal thickness of the hematoma, and midline shifting was measured based on the pineal gland. Hematoma density was classified as high, iso-, low, or mixed based on brain parenchymal density.
4. Burr Hole Drainage
Burr hole drainage was performed under general anesthesia after the effects of the hematoma had been assessed. During the surgery, operation techniques such as one hole vs. two holes and irrigation vs. no irrigation were selected at the surgeon’s discretion. After burr hole drainage, a single catheter was inserted into the subdural space for glabellar and natural drainage over 1 to 3 days. The catheter was removed following sufficient drainage, brain CT evaluation, and improvement of the patient’s symptoms.
5. Follow-up
Brain CT scans were performed at discharge, one month, and three months post-operation in the outpatient department. When deemed necessary by their symptoms and brain CT findings, the patients underwent one additional burr hole drainage procedure. Patient status was assessed at discharge and at a three-month follow-up appointment using the Glasgow Outcome Scale (GOS).
6. Statistics
Statistical analyses were performed using SPSS version 21 (IBM Corp., Armonk, NY, USA). Baseline characteristics of the patient’s symptoms were assessed and compared between the two groups (“severe” vs. “mild”) using the χ2 test, Fisher’s exact test, linear by linear test, or Student’s t-test. To assess the GOS at discharge and the three-month follow-up, univariate analysis of clinical, radiological, and procedural factors was performed using Student’s t-test, Pearson correlation analysis, or Kruskal-Wallis test. Variables with a p-value of <0.1 in the univariate analysis were then selected for multivariate analysis using a multiple linear regression analysis model. In all analyses, p-values ≤0.05 were defined as statistically significant.
RESULTS
Of the 256 patients, 36 (14.1%) were included in the “severe” group and 220 (85.9%) in the “mild” group. One hundred twenty (46.8%) patients had headache and/or vomiting; 13 (5.1%), paraparesis or gait disturbances; nine (3.5%), aphasia or dysarthria; 72 (28.1%), hemiparesis; 38 (14.8%), decreased level of consciousness (drowsy: 27[10.5%], stupor: six (2.3%), semi-coma 5[2.0%]); two (0.8%), syncope; one (0.4%), seizures; and one (0.4%), ptosis. The mean GCS score for all patients was 13.99±2.12.
Statistically significant differences between the two groups were found for the following baseline characteristics: age (p= 0.040), ESRD (p=0.038), alcoholism (p=0.032), GCS score at admission (p<0.001), and hematoma density (p=0.033). The average age of the patients in the “severe” group (68.22±14.70 years) was higher than that of the patients in the “mild” group (64.10±13.49 years). The percentage of patients with ESRD (n=3, 8.3%) was higher in the “severe” than in the “mild” group (n=3, 1.4%), and the percentage of patients with alcoholism (n=5, 13.9%) was also higher in the “severe” than in the “mild” group (n=9, 4.1%). In contrast, the mean GCS score at admission (9.50±2.59) was lower in the “severe” than in the “mild” group (14.73±0.56). Regarding hematoma density, the “severe” group had low (n=14, 38.9% vs. n=53, 24.1%) and mixed (n=10, 27.8% vs. n=46, 21.0%) density hematomas more often than the mild group, and had high (n=1, 2.8% vs. n=22, 10.0%) and iso (n=11, 30.6% vs. n=98, 44.5%) density hematomas less often than the mild group (Table 1).
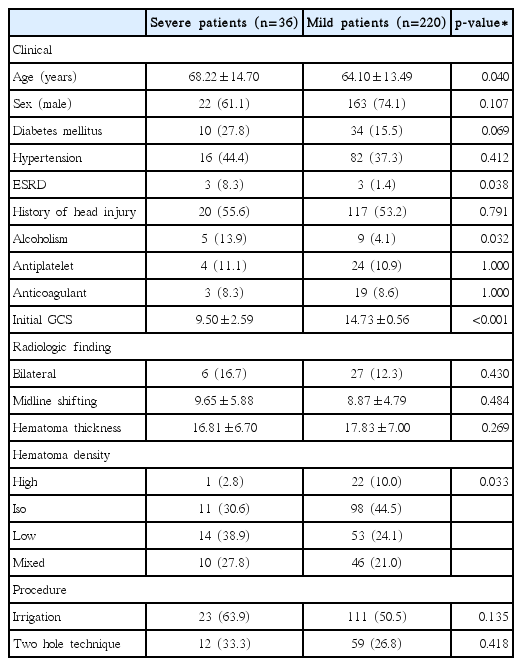
Baseline characteristics in patients with mild and severe
Regarding the GOS score at discharge, the mean value of GOS scores for both groups was 4.73±0.61 (3.83±1.23[n=36] in the “severe” group and 4.79±0.51[n=220] in the “mild” group). ESRD was the only significant variable in the univariate (p=0.005) and multivariate (p=0.018; beta-coefficient [β]=−1.731) analyses. However, according to the GOS scores of the mild group at discharge, age (p=0.001), alcoholism (p<0.001), GCS at admission (p<0.001), and irrigation (p=0.006) were significant in the univariate analysis. Furthermore, age (p=0.004; β=−0.007), GCS at admission (p<0.001; β=0.303), and irrigation (p=0.037; β=0.131) were also significant in the multivariate analysis (Table 2).
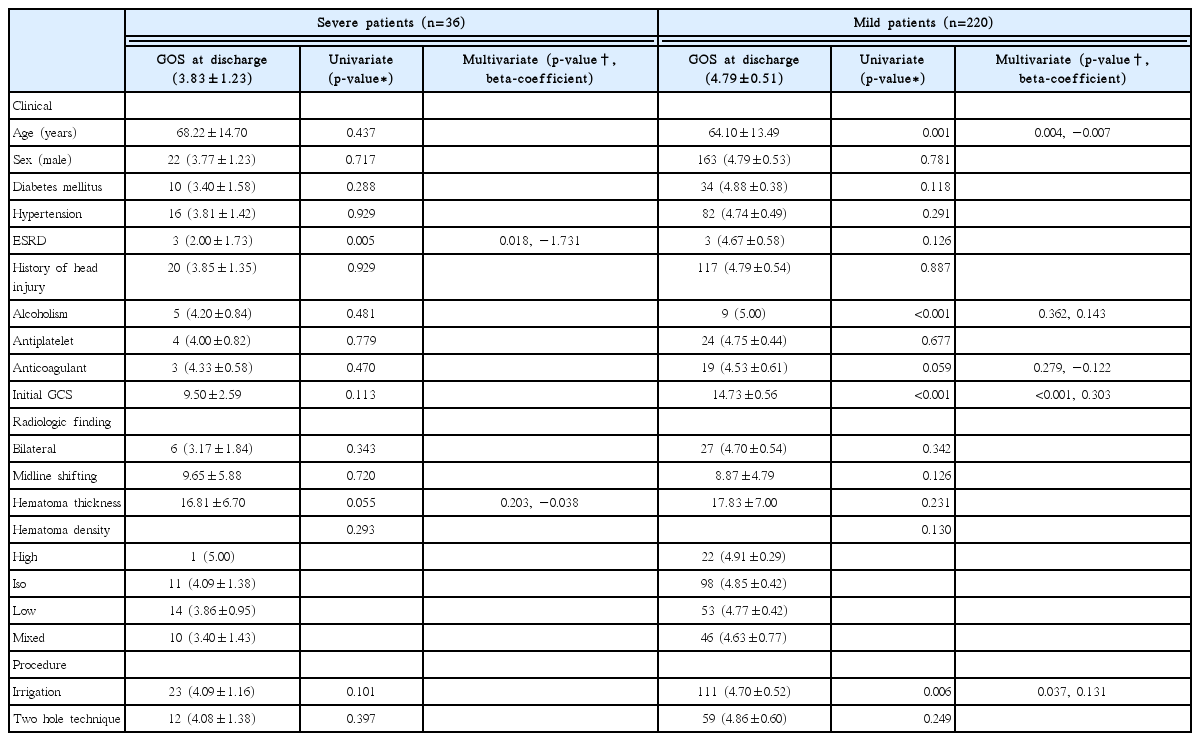
Analysis of variables associated with patient outcome at discharge
Only 243 patients entered the analysis for the GOS three-month follow-up, as 13 patients dropped out (six[16.7%] patients in the “severe” group and seven[3.2%] in the “mild” group). Three (8.3%) patients in the severe group died due to pneumonia, peritonitis, and sudden cardiac arrest. The mean value of the GOS scores at the three-month follow-up was 4.79±0.73 (4.10±1.23[n=30] in the “severe” group and 4.89±0.55[n=213] in the “mild” group). In the “severe” group, there was no significant variable in the univariate analysis. In contrast, in the “mild” group, antiplatelet medication (p=0.003), GCS score at admission (p=0.001), and use of the two-hole technique (p= 0.003) were significant in the univariate analysis, and GCS at admission (p=0.002; β=0.214) was significant in the multivariate analysis (Table 3).
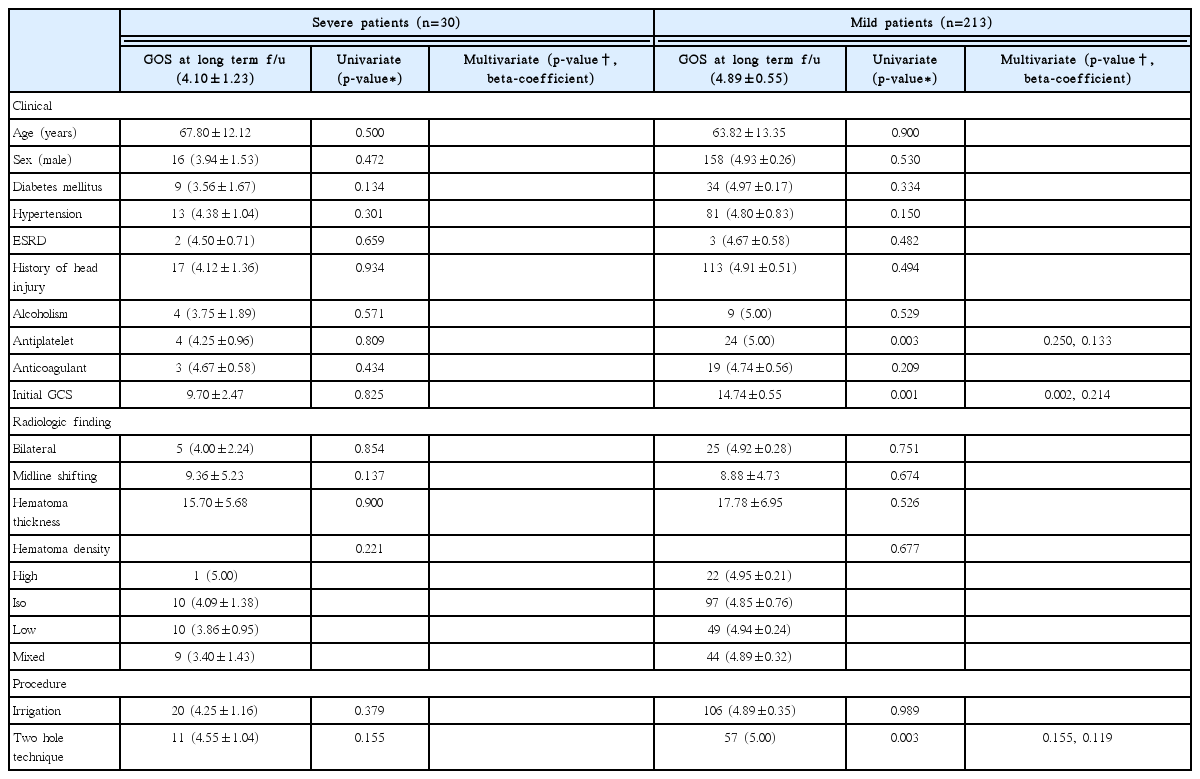
Analysis of variables associated with patient outcome at the three-month f/u
DISCUSSION
CSDH is an intracranial hemorrhage that presents with mild symptoms. It is treated with simple burr hole drainage surgery, which usually yields a promising prognosis16). However, because CSDH causes slow, chronic blood loss, symptoms are often not present until hematoma thickness becomes large. In addition, older patients or patients with brain atrophy due to other factors, such as alcoholism or subdural hygroma after head injury, show symptoms more slowly than patients with no brain atrophy10). Therefore, when such patients show symptoms, hematoma thicknesses is already enlarged and symptom progression is faster. Therefore, older patients, and patients with brain atrophy, with CSDH exhibit more severe symptoms and more negative outcomes6,13).
Among patients with CSDH who underwent burr hole drainage, old age, ESRD, and alcoholism were more common in patients with severe than mild symptoms at admission. It has been reported that these factors are correlated with brain atrophy21). As senile atrophy increases the risk of CSDH and the amount of hematoma, elderly patients with minor head trauma should receive prompt medical attention12). In addition to brain atrophy, hematoma density was another factor that differed significantly between the two groups. Low and mixed-density hematomas were more common in patients with severe symptoms, while high and iso-density hematomas were more common in patients with mild symptoms. Brain CT scans show high density hematomas in the acute phase that tend to decrease in density over time, with the exception of iso-density hematomas in the hyper-acute phase5). Therefore, patients with severe symptoms are more likely to have hematomas for a longer period of time. In addition, repeat bleeding, which may derive from mixed hematomas, is possible to continue if the brain atrophy is more severe.
To prevent negative outcomes following CSDH, some studies have investigated and described certain prognostic factors, such as old age, DM, coagulation, and alcoholism. Among these factors, old age, in particular, has been known to be a powerful factor due to senile brain atrophy. In addition, a low GCS score has also been described as a strong indicator of negative outcomes1). In the present study, the outcome of patients with mild symptoms after burr hole drainage was associated with old age and GCS score at admission. In addition, irrigation during the operation was another significant factor. CSDH may be caused by structural weakness in the neo-vasculature of the hematoma membrane15). It is also known that CSDH resembles the environment of disseminated intravascular coagulation because of repeated transient coagulation and bleeding10). Therefore, the removal of hematomas by irrigation can reduce negative outcomes due to repeat bleeds14).
However, patients with severe symptoms showed different results. Old age, initial GCS, and irrigation were important factors in the recovery of patients with mild symptoms; however, they were not related to outcome. Only ESRD was significantly correlated to outcome. ESRD may represent both renal dysfunction and systemic blood flow and vascular status impairments18). Therefore, it is thought that cerebral blood flow and circulation play an important role in the recovery of the damaged brain3).
In the three-month follow-up, the outcome of the patients with mild symptoms was closely correlated to initial GCS score, but not to old age or irrigation. In general, patients with mild symptoms usually have a promising prognosis and improved symptoms after three months. Therefore, older patients, patients who do not receive irrigation, and patients who receive a low GOS score at discharge, had all recovered at the time of the three-month follow-up, making such factors statistically insignificant in the long-term. Among the three listed factors, the initial GCS may be most strongly associated with the prognosis of patients with mild symptoms (Fig. 1). In addition, the two-hole technique had a significant association with outcome in the univariate analysis, but the significance in the multivariate analysis disappeared. This was confirmed by the fact that the patients who underwent the two-hole technique had higher initial GCS, and that the significance was lost by the adjustment in multivariate analysis (one hole[n=161, mean GCS 14.68] vs. two holes[n=59, mean GCS 14.86], p=0.029). However, none of the factors correlated at the three-month follow-up in patients with severe symptoms. This may be due to a high number of follow-up losses (n=6, 16.7%) in the “severe” group, including a single case of follow-up loss of a patient with ESRD (n=1, 33.3%), or because patients with ESRD, who had a low GOS score at the time of discharge, had recovered during the follow-up period (Fig. 2).
Glasgow Outcome Scale (GOS) at discharge and 3-month follow-up in patients with mild chronic subdural hematoma; (A) comparison according to initial Glasgow Coma Scale (GCS) scores, (B) comparison according to irrigation, (C) comparison according to patient’s age.
Glasgow Outcome Scale (GOS) at discharge and 3-month follow-up in patients with severe chronic subdural hematoma according to end-stage renal disease (ESRD).
Our study had several limitations. First, the study was limited by its retrospective nature. Therefore, selective bias and compounding effects could be present. To avoid this problem, we divided the patients into a “severe” group and a “mild” group according to initial GCS, and the factors affecting each group were examined individually. In addition, we also examined results after a three-month follow-up as well as at discharge. Second, various symptoms of patients with CSDH were divided based on initial GCS score only. However, since it is very challenging to divide the various CSDH symptoms into a single index and GCS is widely used to determine initial status, we divided patient symptom severity by GCS score. Third, operation techniques were based on each surgeon’s discretion of individual patient care. For this reason, patients who had reoperation due to recurrence, had to be excluded due to differences in opinion. Fourth, patient drop-out at the three-month follow-up involved a disproportionally larger number of patients from the “severe” group. This may have also affected the results for irrigation and old age in patients with mild symptoms. However, because the initial GCS was significant, despite the disadvantage of lowering the statistical power; patients with loss of follow-up, it was found that the initial GCS was a powerful factor in the “mild” group. In addition, this may have possibly caused the difference in the result at the time of discharge. Therefore, prospective studies with a large sample size would be necessary to overcome these limitations.
CONCLUSION
Patients with severe CSDH were often older and more commonly had ESRD, low initial GCS scores, and low and mixed density hematomas. In addition, the outcome of patients with mild CSDH who underwent burr hole drainage was correlated with old age, initial GCS score, and irrigation. However, the outcome of patients with severe CSDH was correlated only with ESRD. Therefore, consideration and explanation of the prognosis to the patient is recommended when performing burr hole drainage in patients with CSDH.