| Home | E-Submission | Sitemap | Contact Us |  
top_img
The Nerve > Volume 5(1); 2019 > Article
Tsung, Sung, Son, Lee, and Song: Prediction of Motor Function Outcome in Patients with Brain Injury Using Computed Tomography and Diffusion Tensor Image

Abstract

Objective

Diffusion tensor imaging (DTI) was used to study motor function prognosis in stroke and intracerebral hemorrhage (ICH) patients. In this study, we investigated the correlation between DTI and computed tomography (CT) and compared the predictability of clinical outcome in patients with stoke, ICH, brain tumor, and traumatic brain injury.

Methods

We retrospectively reviewed 22 patients with brain injury who underwent DTI and CT. Motor weakness was assessed using the Medical Research Council (MRC) grade scores. The fractional anisotropy (FA) of the region of interest (ROI) of DTI was compared between the injured and non-injured sites.

Results

The differences in the encephalomalacic changes of corticospinal tract injury between DTI and CT were not statistically significant in patients with motor weakness (p=0.09). Neither modality could predict the motor recovery rate (CT, p=0.89; DTI, p=0.86). However, DTI showed a significant difference in initial MRC grade (p=0.003). We evaluated the possibility of more accurate evaluation of MRC grade change using DTI. FA ROI in injured (450.73±105.32) and non-injured (582.18±99.68) sites showed a significant difference (p=0.00). Pearson’s correlation coefficient showed that FA ROI ratio had a significant correlation with initial (p=0.43) and follow-up (p=0.012) MRC grades, but not with MRC grade change (p=0.67).

Conclusion

DTI is more accurate than CT for evaluating motor deficit. It aids the treatment and rehabilitation plans in patients with brain injury. However, the prediction of motor function recovery is still insufficient.

INTRODUCTION

Motor weakness is the most common neurological symptom in patients with brain injury, such as due to cerebral infarction, traumatic brain injury (TBI), brain tumor, or intracerebral hemorrhage (ICH). These neurological symptoms have sequelae and affect the quality of life and motor functions [5]. The extent of recovery or worsening of neurological symptoms of brain injury cannot be entirely known. However, predictive tools with accurate information can provide the patient with better treatment and scope of rehabilitation. Therefore, researches in fields such as neurosurgery, neurology, and rehabilitation aim to predict the future outcomes of patients’ motor ability through magnetic resonance (MR) imaging (MRI) [4,5,10,14].
The MR diffusion tensor imaging (DTI) of the corticospinal tract has been used for the prognosis of patients with motor weakness [15]. Studies have also reported the prognosis of patients through changes in fractional anisotropy (FA) of DTI [10,14]. DTI tractography is also used to identify nerve fiber roots before surgery to reduce post-operative complications [9,11]. These studies have been conducted to prevent and predict neurological symptoms using DTI and DTI tractography. DTI is a useful tool to study the microstructure of the brain.
However, there are limitations to the ease and access of DTI and DTI tractography use in hospitals compared to computed tomography (CT). In this study, we aimed to compare encephalomalacic lesions between DTI and CT. We studied the accuracy of the prediction of recovery of a patients’ motor function using DTI.

MATERIALS AND METHODS

1. Patient Selection

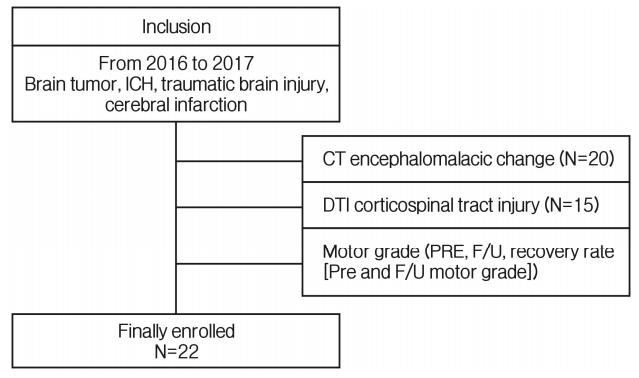
We retrospectively reviewed the medical records of patients with brain injury. A total of 22 patients were recruited in this study (15 men and 7 women). The inclusion criteria were as follows: (1) supratentorial region occupying lesions such as TBI, ICH, cerebral infarction, and brain tumor; (2) motor deficit on the day of admission or emergency room visit; (3) no previous history of stroke, brain injury, or other neurological diseases on CT or MRI; (4) DTI performed in the department of rehabilitation medicine at least 4 weeks after diagnosis (Fig. 1).

2. Clinical Assessment

Patients underwent neurologic examination based on the Medical Research Council (MRC) grade at the first hospital visit and modified Barthel Index (MBI), follow-up MRC grade, and modified Rankin Scale (mRS) index when discharged from the rehabilitation department.

3. Radiology

MRI was performed with 3 Tesla scanner (Verio; Siemens, Erlangen, Germany). DTI data were acquired using single-shot echo-planar imaging (TR, 19,000 ms; TE, 2.19 ms; NEX, 1; matrix size, 215×256; FOV, 250 mm; voxel size, 1.0×1.0×1.0 mm). The brain was imaged with a section thickness of 1 mm and no intersection gaps, on 35 standard axial images. The diffusion-weighted image was encoded along 20 independent orientations, and the b-value was 1,000 s/mm2. A 12-channel phased-array head coil was used. The total imaging time was approximately 7 min and 12 sec. The encephalomalacic lesion on CT was followed up soon with MR DTI for comparison.

4. Image Processing

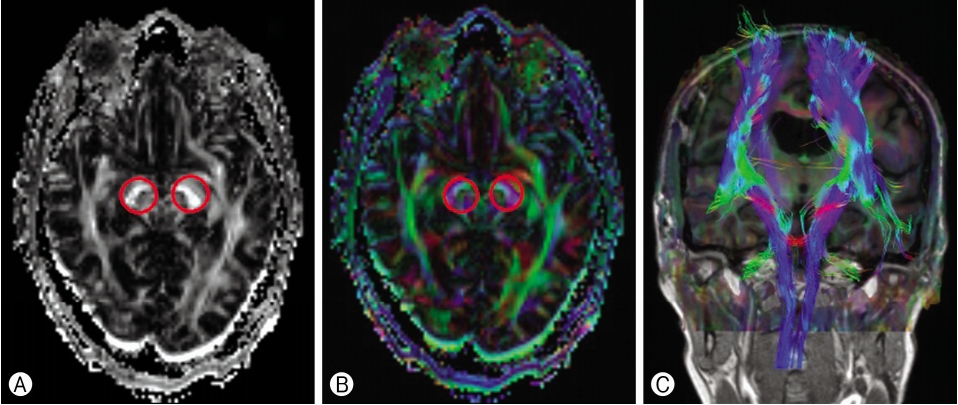
The DTI datasets were transferred to a workstation and processed using Neuro 3D (Siemens). DTI corticospinal tract injury readings were evaluated by an experienced radiologist. The region of interest (ROI) were manually drawn in the bilateral cerebral peduncles on the 2-dimensional FA map of the plane axial coil 20-channel file name ep2d diff MDDW 20 p2. The FA ROI were compared between the injury and non-injury sites. Additionally, the FA ROI ratio (FA-valued injury/non-injury) was calculated (Fig. 2).

5. Statistical Analysis

The analyses were performed using the SPSS software version 21 for Windows (SPSS Inc., Chicago, IL, USA). A p-value of less than 0.05 was considered significant. The values were presented as mean±standard deviation (SD). The continuous variables were presented as mean±SD for parametric data. A group comparison was made using the χ2 test. The Shapiro-Wilk test was used to confirm normal distribution (p>0.05). The Pearson’s correlation coefficient analysis was used to find the correlations among the continuous variables.

RESULTS

Table 1 shows the demographics, clinical scores, and radiologic findings of the subjects. The mean age was 65.73±10.51 years. The lesions were located in the frontal lobe, basal ganglia, thalamus, insula, anterior communicated artery, and middle cerebral artery in 6, 6, 3, 1, 1, and 5 cases, respectively. DTI was performed within 138 days from the diagnosis, irrespective of surgery. Motor weakness was studied using the MRC grade, MBI, and mRS.
Table 2 shows the comparison of encephalomalacic lesions between DTI and CT. The association of corticospinal tract injury with CT encephalomalacic change appears in 15 patients. The differences between the encephalomalacic lesions on DTI and CT were not statistically significant (p=0.09).
Table 3 shows MRC grade in correlation with CT and DTI. The differences in MRC grade on CT between injury and noninjury sites were not statistically significant (upper MRC grade, CT non-injury site, 3±1.41, CT injury site, 2.37±1.30, p=0.523; lower MRC grade, CT non-injury site, 4.50±0.71, CT injury site, 2.68±1.49, p=0.111). In contrast, DTI showed a significant difference in MRC grade despite the small sample size (upper MRC grade, DTI non-injury site, 3.67±1.37, DTI injury site, 1.93±0.88, p=0.03; lower MRC grade, DTI non-injury site, 4.67±0.52, DTI injury site, 2.13±1.25, p=0.00). However, neither modality could predict the recovery rate (CT, p=0.89; DTI, p=0.86).
Table 4 shows the FA ROI in the cerebral peduncle and its ratio of the injury to the non-injury sites. In this table, we can compare the FA ROI ratio with the MRC grade change. Patient number 3, 4, 5, 12, 13, 16, 18, 19, and 20 had an improved MRC grade. The ROI on injury (450.73±105.32) and non-injury FA (582.18±99.68) showed that FA significantly decreased on the injury site (p=0.00).
Table 5 shows the correlation between FA ROI ratio and MRC grade change. The Pearson’s correlation coefficient showed a significant difference in initial (p=0.43) and follow-up (p=0.012) MRC grades, but not in MRC grade change (p=0.67)

DISCUSSION

In most patients with brain injury, the first diagnostic imaging is performed using CT. It has many advantages over MRI, such as of accessibility, cost, and imaging time, and it can be used for rapid therapeutic planning, especially in patients with TBI [13]. However, there are limitations to the information that CT provides. Hence, patients have to undergo MRI. Currently, more detailed DTI, diffusion tensor tractography, and functional MRI than conventional MRI are also being tested [2].
We compared encephalomalacic lesions on DTI and CT. The images were analyzed by a trained radiologist. The results did not have a clear statistical significance in the differences of encephalomalacic lesions between DTI and CT (p<0.091) (Table 2). Although the results were not statistically significant, Ganesan et al. [6] found that the magnitude of the brain injury detected on conventional MRI were associated with poor motor function and patient outcome. The observed neurologic symptoms of patients suggested that CT encephalomalacic changes in size could predict the recovery of the patient's clinical symptoms. No statistical significance could be observed in this study probably because of the small sample size.
To confirm the accuracy and significance of DTI, we examined the correlation between CT and DTI in patients with motor weakness. DTI showed statistical difference in upper MRC grade (p<0.03) and lower MRC grade (p<0.00) (Table 3). Thus, DTI can diagnose patients’ neurological symptoms more accurately than CT. In addition, DTI is useful to diagnose axonal injury in patients with TBI who have normal CT and conventional MRI findings [12]. The information provided by DTI also helps patients’ early rehabilitation, which is closely related to patient outcome. In addition, as shown in Table 1, there are other factors affecting brain injury in each case. Neither the type of surgery nor the damaged brain site (basal ganglia, thalamus, cortex, and vascular territory) had a significant effect on patient outcome.
In many studies, the outcome of patients with brain injury (tumor, TBI, ICH) was assessed using FA of DTI [8,9,17]. FA is a measure of diffusional anisotropy on a unitless scale from 0 to 1. An FA of 0 signifies that water freely diffuses in all directions, while an FA of 1 signifies that water uniformly diffuses in one direction [1]. In studies involving FA, the pyramidal tract FA values reduced in patients with motor weakness. These changes were correlated with the patient’s clinical symptoms and also affected their functional outcomes [3,18]. We compared FA ROI on the injury and non-injury sites to predict the recovery of the patient’s motor function using a ratio of the 2 values. FA ROI value was lower on the injury than on the non-injury sites (Table 4). These results were not different from previous studies [3,18,20]. The FA ROI ratio seems to be related to the motor status but not to the prediction of motor recovery. We obtained the FA ratio of the injury sites to the non-injury sites at one time point. Therefore, it did not predict the motor recovery. Yokoyama et al. [20] reported that an improvement in FA ratio was associated with a rapid recovery of motor weakness symptoms. In addition, reversible loss in FA ratio due to vasogenic edema and mass effect was more likely to predict recovery in motor weakness than that due to direct tract injury [8,19]. Therefore, additional researches are required to correlate change in ROI with motor recovery.
In this study, 22 cases were included, and it was difficult to obtain relevance and accuracy. It is believed that statistical significance would be seen in numerical value with large sample sizes. In addition, there were no professional engineers to use the software in DTI, which is a limitation in many hospitals. However, hospitals have an expert radiologist and when compared to unprocessed DTI, limited CT may be helpful in assessing the patient's prognosis. Inclusion of various diseases causing the brain injury neglected the differences among the diseases, and there were limitations of the retrospective study design. We did not compare the initial and follow-up DTI, although changes in FA values appeared on DTI after 4 weeks. Our DTI was performed at intervals of at least 4 weeks. This suggested that gliosis and volume loss on TBI appeared after 3 weeks. CT was also used after 3 weeks from the diagnosis [7,16].

CONCLUSION

Clinical outcome prediction and surgical planning in patients with brain injury can be achieved using easily accessible CT. However, a new imaging tool called DTI is more accurate than CT, although there are technological limitations, such as tractography and navigation, of using DTI in hospitals. Therefore, DTI can be used to design appropriate treatment and rehabilitation plans for the patient, but the prediction of motor function recovery is still insufficient.

CONFLICTS OF INTEREST

No potential conflict of interest relevant to this article was reported.

Fig. 1.
Flow diagram depicting the patient inclusion process. ICH: intracerebral hemorrhage; CT: computed tomography; DTI: diffusion tensor imaging; F/U: follow-up.
nv-5-1-1f1.jpg
Fig. 2.
(A) The regions of interest were manually drawn in the bilateral cerebral peduncles on the 2- dimensional fractional anisotropy (2D FA) map (circle). (B) Same regions of 2D FA color (circle), (C) compare the injury and non-injury region on diffusion tensor tractography.
nv-5-1-1f2.jpg
Table 1.
Demographics, radiologic image finding, and clinical score
Age (year)/Sex Side, location DTI interval (days) DTI injury CT/w malacia change Op Motor grade (upper/lower) Motor grade (upper/lower) f/u MBI mRS
1 87/M Lt. MCA 21 1 1 0 2/2 2/2 5 5
2 64/M Lt. BG 81 1 1 1 1/1 1/1 0 5
3 54/F Rt. F-P 39 1 1 1 1/2 4/4 88 1
4 59/M Lt. BG 35 1 1 1 1/1 2/2 7 3
5 81/M Lt. insula 12 0 0 0 2/5 5/5 68 3
6 71/F Rt. MCA, BG 44 1 1 0 4/5 4/5 73 2
7 61/M Lt. F 54 0 1 1 5/5 3/3 42 3
8 69/F Lt. thalamus 27 1 1 1 1/1 0/0 7 5
9 60/M Rt. BG 40 1 1 1 2/2 1/1 3 4
10 74/M Lt. BG 33 0 1 0 5/5 5/5 55 1
11 63/M Rt. F 49 1 1 0 2/1 2/1 0 5
12 88/M Lt. MCA 20 0 1 0 2/5 5/5 69 2
13 52/F Rt. BG 79 1 1 0 2/2 3/3 55 3
14 57/M Lt. F 138 0 1 1 4/4 4/4 59 2
15 61/F SAH (a-com) 71 0 0 1 4/4 4/4 91 1
16 63/F Lt. thalamus 22 1 1 0 2/2 3/3 65 3
17 71/M Rt. thalamus 18 1 1 0 3/3 3/3 79 3
18 48/M Rt. BG 28 1 1 0 3/4 4/4 75 3
19 62/M Rt. F-T-P 40 1 1 1 2/2 3/3 43 5
20 73/M Rt. F 52 1 1 0 2/2 5/5 72 2
21 70/F Lt. MCA 29 1 1 0 1/2 1/1 3 4
22 58/M Lt. F 23 0 1 0 5/5 4/3 88 1

M: male; F: female; Lt.: left; Rt.: right; MCA: middle cerebral artery; BG: basal ganglia; F: frontal; T: temporal; P: parietal; SAH: subarachnoid hemorrhage; a-com: anterior communicated artery; DTI: diffusion tensor imaging; CT: computed tomography; Op: operation; f/u: follow-up; MBI: modified Barthel Index; mRS: modified Rankin Scale.

Table 2.
Relationship of computed tomography encephalomalacic change and diffusion tensor image corticospinal tract injury
CT non-injury group CT injury group Total p-value
DTI non-injury group 2 5 7
DTI injury group 0 15 15 0.091
Total 2 20 22

CT: computed tomography; DTI: diffusion tensor imaging.

Table 3.
Medical Research Council grade correlation with computed tomography and diffusion tensor imaging
CT non-injury group CT injury group p-value DTI non-injury group DTI injury group p-value
Pre-upper motor grade 3.00±1.41 2.37±1.30 0.523 3.67±1.37 1.93±0.88 0.030
Upper motor grade f/u 4.50±0.71 2.95±1.47 0.162 4.29±0.76 2.53±1.41 0.060
Recovery upper motor grade 0.75±1.06 0.38±0.88 0.579 0.47±0.80 0.39±0.93 0.860
Pre-lower motor grade 4.50±0.71 2.68±1.49 0.111 4.67±0.52 2.13±1.25 0.000
Lower motor grade f/u 4.50±0.71 2.90±1.55 0.172 4.14±0.90 2.53±1.55 0.020
Recovery lower motor grade 0.00±0.00 0.17±0.59 0.753 0.07±0.16 0.20±0.65 0.340

f/u: follow-up; CT: computed tomography; DTI: diffusion tensor imaging.

Table 4.
Comparison with fractional anisotropy region of interest about corticospinal tract injury
Age/Sex FA ROI
FA ROI ratio Motor grade upper Motor grade upper f/u Motor grade lower Motor grade lower f/u
Injury* Non-injury
1 87/M 248 510 0.49 2 2 2 2
2 64/M 303 582 0.52 1 1 1 1
3 54/F 556 707 0.79 1 4 2 4
4 59/M 424 636 0.67 1 2 1 2
5 81/M 674 740 0.91 2 5 5 5
6 71/F 474 642 0.74 4 4 5 5
7 61/M 482 640 0.75 5 3 5 3
8 69/F 383 512 0.75 1 0 1 0
9 60/M 305 575 0.53 2 1 2 1
10 74/M 409 509 0.80 5 5 5 5
11 63/M 486 504 0.96 2 2 1 1
12 88/M 667 755 0.88 2 5 5 5
13 52/F 383 529 0.72 2 3 2 3
14 57/M 448 457 0.98 4 4 4 4
15 61/F 454 514 0.88 4 4 4 4
16 63/F 443 576 0.77 2 3 2 3
17 71/M 465 542 0.86 3 3 3 3
18 48/M 421 508 0.83 3 4 4 4
19 62/M 505 698 0.72 2 3 2 3
20 73/M 343 369 0.93 2 5 2 5
21 70/F 209 601 0.35 1 1 2 1
22 58/M 543 588 0.92 5 4 5 3

M: male; F: female; FA, fractional anisotropy; ROI, region of interest; f/u: follow-up.

* Mean±standard deviation=450.73±105.32.

Mean±standard deviation=582.18±99.68.

p-value=0.00.

Table 5.
Correlation of ratios of fractional anisotropy of the region of interest and change of motor grade
rFA ROI Upper motor change Lower motor change Upper motor grade Lower motor grade Upper motor grade f/u Lower motor grade f/u
Pearson 0.302 0.099 0.445 0.481 0.641 0.527
p-value 0.184 0.670 0.043 0.027 0.001 0.012

rFA ROI: ratio of the fractional anisotropy region of interest; f/u: follow-up.

REFERENCES

1. Basser PJ, Mattiello J, LeBihan D: MR diffusion tensor spectroscopy and imaging. Biophys J 66:259-267, 1994
crossref pmid pmc
2. Brody DL, Mac Donald CL, Shimony JS: Current and future diagnostic tools for traumatic brain injury: CT, conventional MRI, and diffusion tensor imaging. Handb Clin Neurol 127:267-275, 2015
crossref pmid
3. Buffon F, Molko N, Hervé D, Porcher R, Denghien I, Pappata S: Longitudinal diffusion changes in cerebral hemispheres after MCA infarcts. J Cereb Blood Flow Metab 25:641-650, 2005
crossref pmid
4. Cho SH, Kim SH, Choi BY, Cho SH, Kang JH, Lee CH, et al.: Motor outcome according to diffusion tensor tractography findings in the early stage of intracerebral hemorrhage. Neurosci Lett 421:142-146, 2007
crossref
5. Duncan PW, Goldstein LB, Matchar D, Divine GW, Feussner J: Measurement of motor recovery after stroke. Outcome assessment and sample size requirements. Stroke 23:1084-1089, 1992
crossref pmid
6. Ganesan V, Ng V, Chong WK, Kirkham FJ, Connelly A: Lesion volume, lesion location, and outcome after middle cerebral artery territory stroke. Arch Dis Child 81:295-300, 1999
crossref pmid pmc
7. Inoue Y, Matsumura Y, Fukuda T, Nemoto Y, Shirahata N, Suzuki T, et al.: MR imaging of Wallerian degeneration in the brainstem: temporal relationships. AJNR Am J Neuroradiol 11:897-902, 1990
pmid
8. Kim CH, Chung CK, Kim JS, Jahng TA, Lee JH, Song IC: Use of diffusion tensor imaging to evaluate weakness. J Neurosurg 106:111-118, 2007
crossref
9. Kim MS, Chung CK, Jung HW, Park CK, Kim CH, Kim JS: Preoperative weakness and demyelination of the corticospinal tract in meningioma patients: changes in diffusion parameters using diffusion tensor imaging. J Korean Neurosurg Soc 55:267-272, 2014
crossref pmid pmc
10. Kusano Y, Seguchi T, Horiuchi T, Kakizawa Y, Kobayashi T, Tanaka Y, et al.: Prediction of functional outcome in acute cerebral hemorrhage using diffusion tensor imaging at 3T: a prospective study. AJNR Am J Neuroradiol 30:1561-1565, 2009
crossref pmid
11. Laundre BJ, Jellison BJ, Badie B, Alexander AL, Field AS: Diffusion tensor imaging of the corticospinal tract before and after mass resection as correlated with clinical motor findings: preliminary data. AJNR Am J Neuroradiol 26:791-796, 2005
pmid
12. Niogi SN, Mukherjee P: Diffusion tensor imaging of mild traumatic brain injury. J Head Trauma Rehabil 25:241-255, 2010
crossref pmid
13. Prabhu SP: The role of neuroimaging in sport-related concussion. Clin Sports Med 30:103-114; ix. 2011
crossref pmid
14. Puig J, Pedraza S, Blasco G, Daunis IEJ, Prats A, Prados F, et al.: Wallerian degeneration in the corticospinal tract evaluated by diffusion tensor imaging correlates with motor deficit 30 days after middle cerebral artery ischemic stroke. AJNR Am J Neuroradiol 31:1324-1330, 2010
crossref pmid
15. Sawlani V, Gupta RK, Singh MK, Kohli A: MRI demonstration of Wallerian degeneration in various intracranial lesions and its clinical implications. J Neurol Sci 146:103-108, 1997
crossref pmid
16. Trivedi MA, Ward MA, Hess TM, Gale SD, Dempsey RJ, Rowley HA, et al.: Longitudinal changes in global brain volume between 79 and 409 days after traumatic brain injury: relationship with duration of coma. J Neurotrauma 24:766-771, 2007
crossref pmid pmc
17. Watanabe T, Honda Y, Fujii Y, Koyama M, Matsuzawa H, Tanaka R: Three-dimensional anisotropy contrast magnetic resonance axonography to predict the prognosis for motor function in patients suffering from stroke. J Neurosurg 94:955-960, 2001
crossref pmid
18. Werring DJ, Toosy AT, Clark CA, Parker GJ, Barker GJ, Miller DH, et al.: Diffusion tensor imaging can detect and quantify corticospinal tract degeneration after stroke. J Neurol Neurosurg Psychiatry 69:269-272, 2000
crossref pmid pmc
19. Yamada K, Kizu O, Mori S, Ito H, Nakamura H, Yuen S, et al.: Brain fiber tracking with clinically feasible diffusion-tensor MR imaging: initial experience. Radiology 227:295-301, 2003
crossref pmid
20. Yokoyama K, Matsuki M, Shimano H, Sumioka S, Ikenaga T, Hanabusa K, et al.: Diffusion tensor imaging in chronic subdural hematoma: correlation between clinical signs and fractional anisotropy in the pyramidal tract. AJNR Am J Neuroradiol 29:1159-1163, 2008
crossref pmid
TOOLS
PDF Links  PDF Links
PubReader  PubReader
ePub Link  ePub Link
XML Download  XML Download
Full text via DOI  Full text via DOI
Download Citation  Download Citation
  Print
Share:      
METRICS
0
Crossref
6,310
View
124
Download
Related article
Editorial Office
Department of Neurosurgery, Dankook University Hospital
201, Manghyang-ro, Dongnam-gu, Cheonan-si, Chungcheongnam-do 31116, South Korea
TEL: +0082-41-550-6280   FAX: +82-41-556-0524   
E-mail: spine1225@naver.com , mousehunt7@naver.com
About |  Browse Articles |  Current Issue |  For Authors and Reviewers
Copyright © The Korean Society of Peripheral Nervous System.                 Developed in M2PI