


INTRODUCTION
Osteoporosis is emerging as a serious health problem worldwide24,33). An accurate examination of the bone mineral density (BMD) is important for treating the elderly of osteoporosis; it affects the prediction of the clinical prognosis, such as the fracture risk calculation, and the treatment choice18). As the elderly population increases, the proportion of patients with osteoporosis is expected to increase. In particular, in spinal fusion surgery, osteoporosis is closely related to the clinical outcome because the fusion rate and degree of subsidence differ according to the patient’s BMD. The prevalence of osteoporosis in patients requiring spinal surgery has also increased.
Dual energy X-ray absorptiometry (DXA) is the gold standard method of measuring the areal BMD of the lumbar spine and hip10). This technique determines the two-dimensional BMD, including both the trabecular and cortical bone. During DXA measurements, two X-ray beams are directed at the bone. The bone density can be calculated from the absorption of each beam by the bone after subtracting the beam quantity absorbed by soft tissue25). In contrast, quantitative computed tomography (QCT) is a representative technology to complement DXA. With the progression of computed tomography (CT) diagnosis technology, QCT was developed to measure bone density. QCT is performed on a CT scanner using a calibration phantom and dedicated computer software for analysis. Calibration phantoms are devices composed of material similar to the bone mineral structure. they are needed to convert the attenuation measured in Hounsfield units into BMD values3,15). In an estimation of the BMD, the trabecular bone is more important than the cortical bone because most of the bone mineral metabolism occurs in the trabecular bone. QCT can differentiate the cancellous bone so that it is more sensitive to the detection of osteoporosis and for monitoring the changes in the bony structures than DXA1,23). Owing to the difference between DXA and QCT, clinicians sometimes experience conflicting results from the two studies. For example, the BMD measured by DXA may be overestimated due to increased bone surface with degenerative changes7,31,39). Another study reported that 55% to 90% of osteoporotic fractures appeared in individuals without a diagnosis of osteoporosis by DXA28).
Despite the advanced volumetric measurements by QCT, DXA remains the most popular diagnostic measurement with several advantages, including low radiation dose, rapid data analysis, medium price, and easy handling2,18). In most cases, clinicians make decisions on patients with potential osteoporosis using only DXA. Therefore, it is important to recognize the risk factors that cause an overestimation of the DXA values. Many studies have reported that patients with obesity, bone degenerative changes, and aortic calcification may have an overestimate BMD value when examined with DXA36). On the other hand, most studies lacked advanced spinal imaging, such as CT and magnetic resonance imaging (MRI). This study examined the factors causing the discrepancy between DXA and QCT using imaging data, such as spinal MRI and CT of the lumbar spine.
MATERIALS AND METHODS
1. Study Design
The medical data of 59 patients who underwent DXA and QCT between June 2018 and July 2019 were reviewed. Each patient was scanned on Prodigy DXA (GE Healthcare, Madison, WI, USA) and a 256-slice GE Revolution CT scanner (GE Healthcare). Prodigy DXA scans were analyzed by Lunar Prodigy Advance enCORE Version 17 (GE Healthcare), and CT scans were processed using QCTPro software (Mindways Software, Inc., Austin, TX, USA). The DXA software marked regions of interest (ROI) consisted of the L1 through L4 vertebrae area5). QCT software included two vertebrae between T11 and L4, usually L1 and L2. ROI of QCT measured the trabecular BMD in isolation of selected vertebrae.
These examinations were performed with an interval of less than six months. All data, including the clinical and radiologic results, were reviewed retrospectively from the electronic medical records.
The Institutional Review Board (IRB) at the authors’ institute (IRB No. 2020-01-002) approved this study, and the informed consent requirement was waived. Patients with a history of infection, tumors, or previous laminectomy were excluded.
All patients were classified into normal, osteopenia, or osteoporosis from the results of DXA according to the World Health Organization classification. Osteoporosis is defined as a BMD of 2.5 standard deviations (SDs) or more below the average for young, healthy women (a T-score of <−2.5 SD). Osteopenia was defined as a BMD below the normal value (a T-score between −1 to −2.5)8). The results of QCT were also classified according to The American College of Radiology diagnostic categories. Osteoporosis was defined by a trabecular BMD <80mg/cm3 and osteopenia 80≤BMD ≤120mg/cm3. The patients were classified into the concordance or discordance group depending on the agreement between the DXA and QCT results. The concordance group included patients with consistent BMD results of DXA and QCT, and the discordance group included patients whose BMD results were overestimated in DXA compared to QCT.
2. Radiologic Evaluation
Plain radiographs of the lumbar spine and MRI were taken in all enrolled patients. Lumbar lordosis was defined as the Cobb angle between the inferior endplate of T12 and the superior endplate of S1 in a lateral image with a neutral position14). The presence of scoliosis was defined if the Cobb angle between the lumbar vertebrae exceeded 10º in the anterior-posterior image6). The presence of prior surgical instrumentation, including bone cement, was also confirmed16).
3. Lumbar Spondylosis
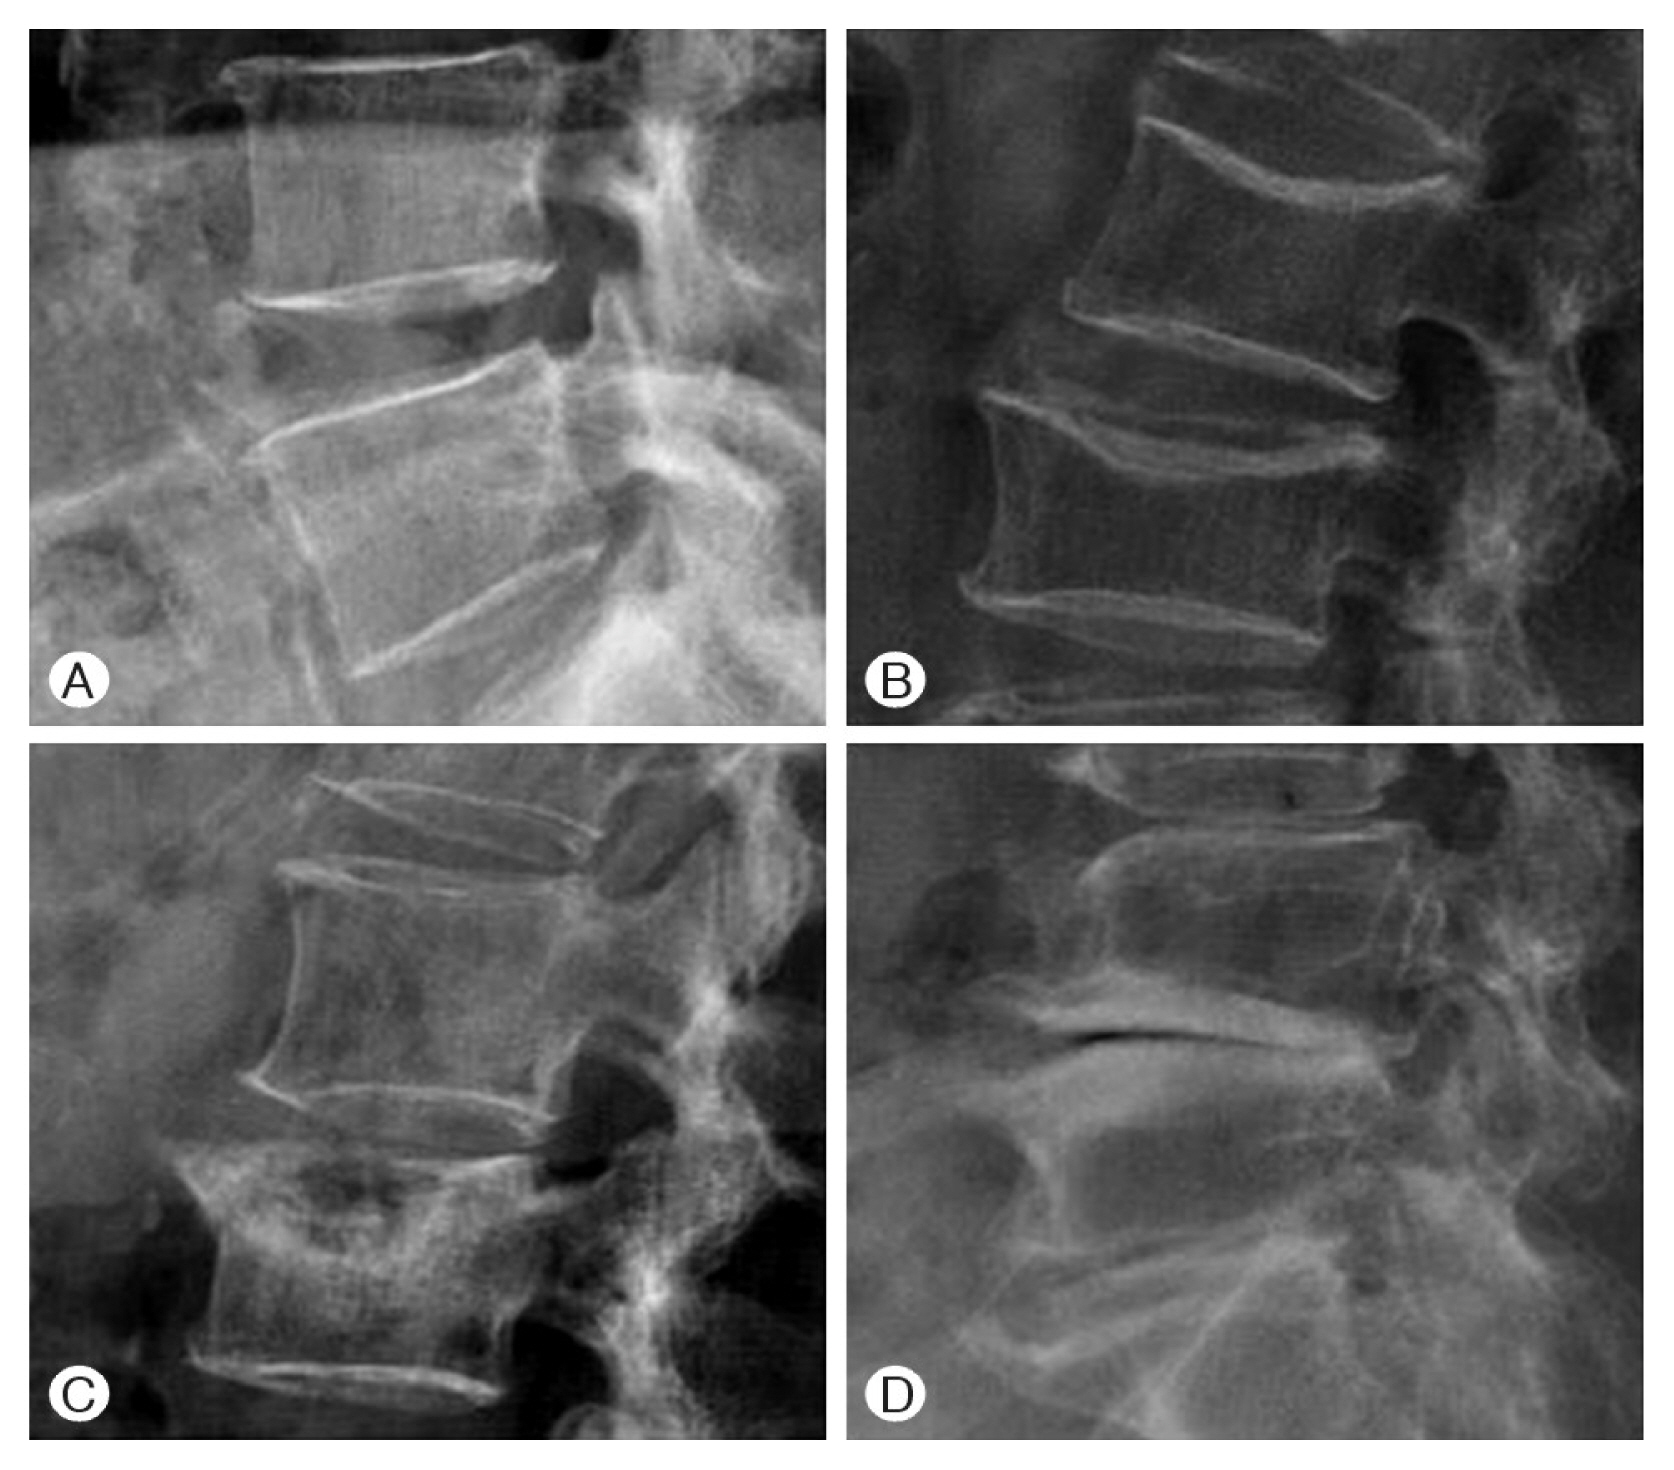
Spondylosis was scored at all lumbar vertebrae using the Kellgren-Lawrence (KL) method as follows: KL1, slight osteophytes; KL2, definite osteophytes; KL3, disc space narrowing with osteophytes; KL4, bone sclerosis, disc space narrowing, and large osteophytes (Fig. 1). The scores from each lumbar intervertebral disc were then combined22,37).
4. Abdominal Aorta Calcification (AAC)
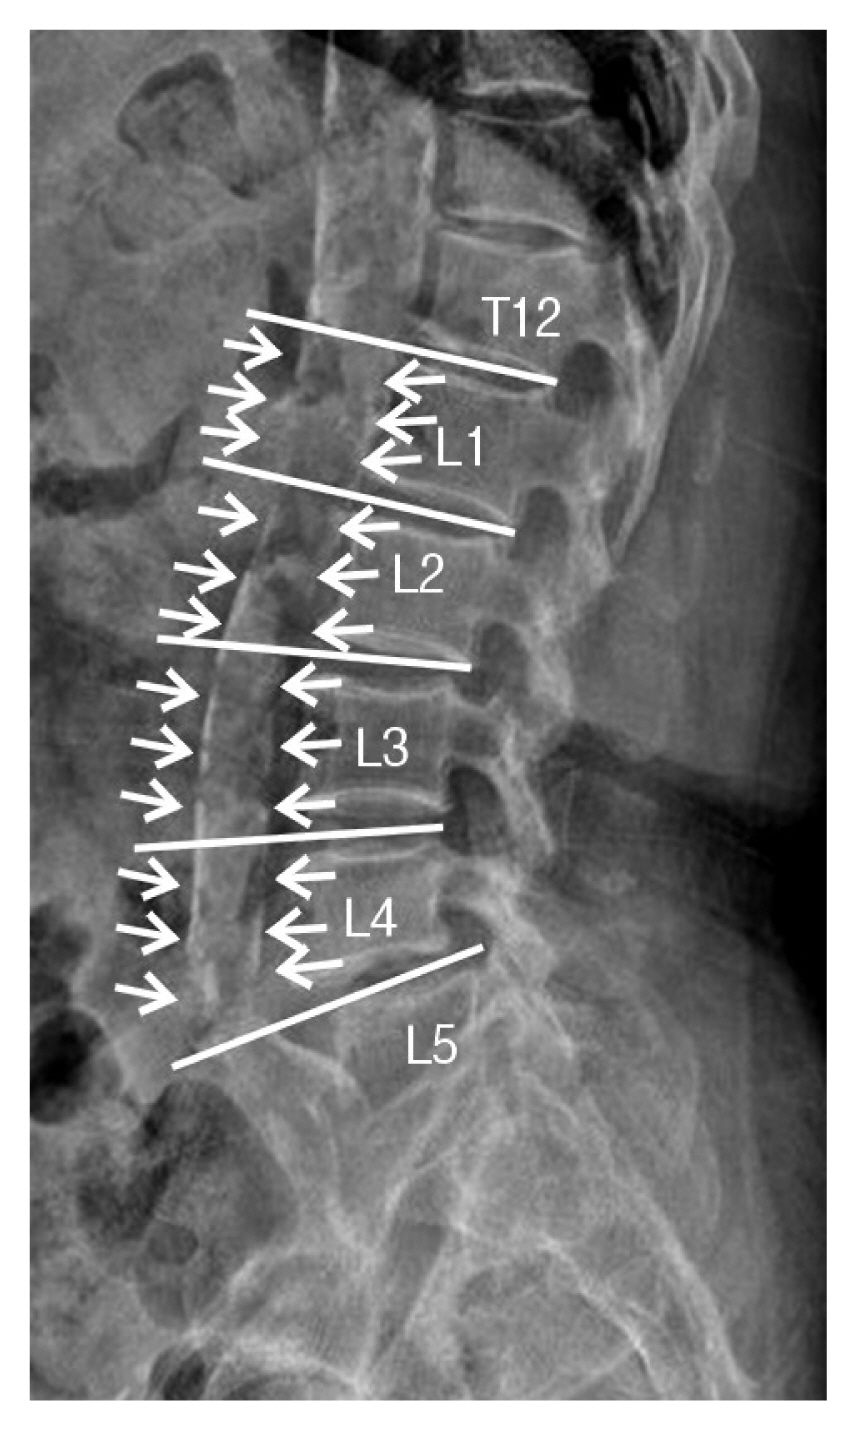
The degree of AAC was quantified using the AAC-8 scale, which evaluates the anterior and posterior abdominal aortic wall calcification in front of the vertebral body from L1 to L4. Both the anterior and posterior aortic wall calcification were scored from 0 to 4 so that the total score ranged from 0 to 8 as follows: 0, no calcification is seen; 1, length of calcification is equal to the height of one vertebra or less; 2, the length is more than one but less than or equal to the heights of two vertebrae; 3, the length is more than two but less than or equal to the heights of three vertebrae; 4, the length of calcification was more than the height of three vertebrae (Fig. 2)19).
5. Modic Endplate Change
The Modic change might affect the BMD of DXA. In each group, patients with Modic changes were classified into three types according to the lumbar spine MRI results. Type I represents bone marrow edema and inflammation. Type II represents the conversion of normal red hemopoietic bone marrow into yellow fatty marrow due to marrow ischemia. Type III represents subchondral bony sclerosis9,20,26).
6. Facet Joint Degeneration
The facet joint is located between the superior and inferior processes of the vertebra and is composed of an articular capsule, cartilage, and synovium. The facet joint degeneration is similar to other synovial joints, such as the knee17,30,41). A larger facet with degenerative changes also cause discordance between the DXA and QCT results. Facet degeneration was graded from 0 to 3 with axial images per lumbar spinal segment of the CT and MRI data.: grade 0, normal facet joint space (2±4mm width); grade 1, narrowing of the facet joint space (<2mm) and/or small osteophytes and/or mild hypertrophy of the articular process; grade 2, narrowing of the facet joint space and/or moderate osteophytes and/or moderate hypertrophy of the articular process and/or mild subarticular bone erosions; and grade 3, narrowing of the facet joint space and/or large osteophytes and/or severe hypertrophy of the articular process and/or severe subarticular bone erosions and/or subchondral cysts29,38). The facet joint degeneration grade was measured for all lumbar spine levels of the patient, and each grade was combined.
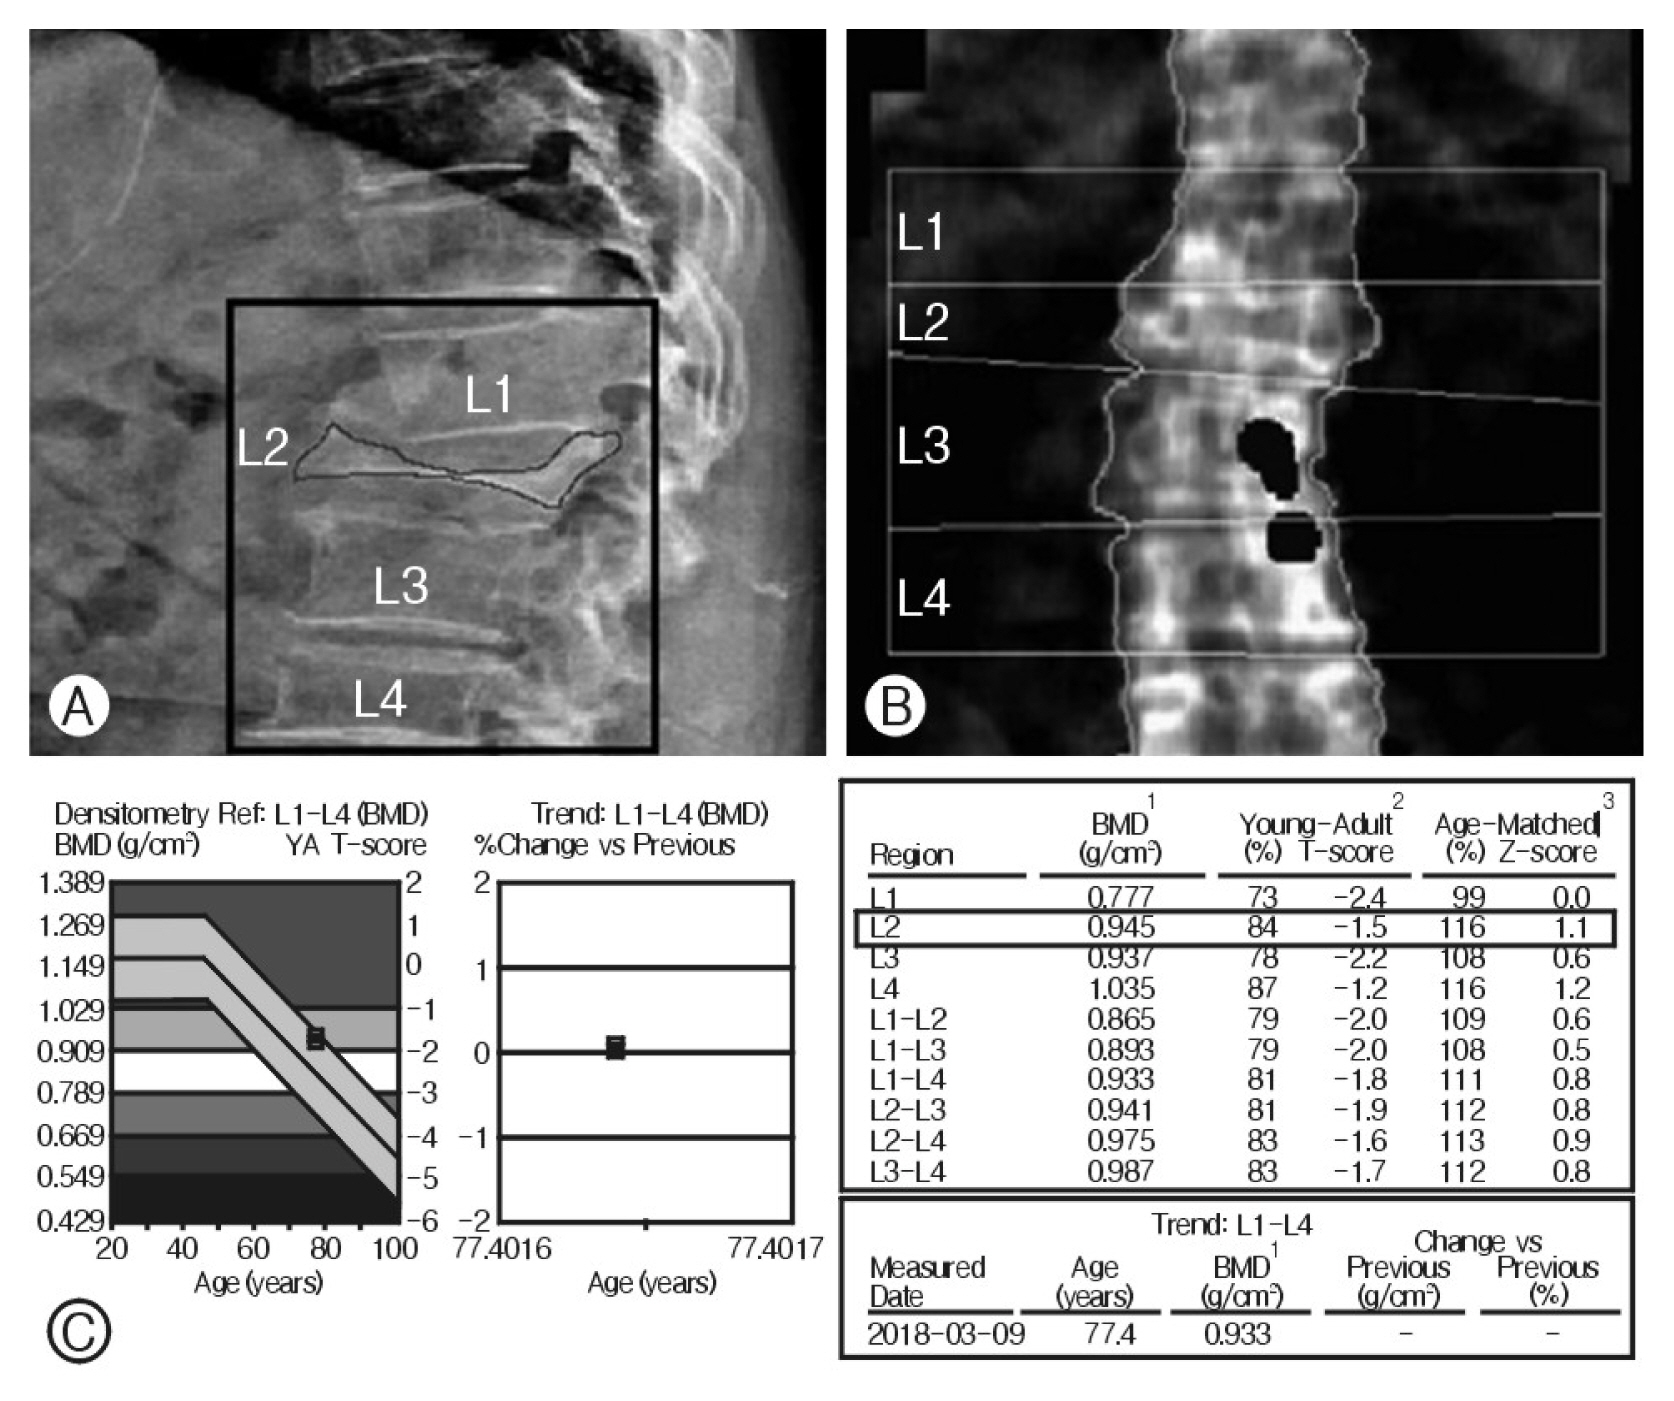
7. DXA Measurement at the Fracture Site
Ideally, DXA measurements should be limited to a normal-shaped vertebra. On the other hand, confirming a vertebral fracture and subsequent wedging deformity with a blurred anterior-posterior image on DXA is difficult, especially if are no further images to detect the wedging. As a result, radiology technicians sometimes include DXA measurements at the fracture site unintentionally (Fig. 3) This technical error is considered a risk factor that might affect the areal BMD estimated by DXA.
8. Statistical Analysis
The descriptive data are pesented as the mean±SD. The χ2 test and Fisher exact test were performed to compare the categorical variables between two independent groups. A Student’s t-test was performed to compare the continuous variables between two independent groups; p-values less than 0.05 were considered statistically significant. Multivariate logistic regression analysis was used to analyze the possible risk factors with backward elimination. All statistical analyses were performed using SPSS version 20.0(SPSS Inc., Chicago, IL, USA).
RESULTS
1. Baseline Characteristics
The sex ratio was not different significantly between the two groups (M:F=10:15 vs. M:F=10:24). The mean age of the discordance group was significantly higher than that of the concordance group (66.84±12.73 vs. 73.64±7.48). The physical conditions, including height, weight, and body mass index (BMI), were no disparity in both groups. The presence of prior spinal instrumentation or cement augmentation was similar in both groups (p=0.587). The mean number of vertebrae with a wedging deformity due to prior compression fractures was 0.72±0.79 and 1.00±0.98 for the concordance and discordance groups, respectively. The difference was not significant (p=0.247). Thus, except for age, the remaining demographic data did not show significant differences between the two groups (Table 1).
2. The Two-groups Classification for Comparison
Among the 59 patients enrolled, DXA showed an overestimation in 34 patients for the detection of osteoporosis compared to QCT. They were classified as follows: normal on DXA and osteopenia on QCT, normal or osteopenia on DXA, and osteoporosis on QCT. These patients were defined as a discordance group. On the other hand, 23 patients demonstrated the same diagnosis on both DXA and QCT. Only two patients showed an underestimation of DXA compared to QCT. These 25 patients were defined as the concordance group (Table 2).
3. Risk Factor Comparison
The risk factors identified by further lumbar imaging studies were compared between the two groups. Lumbar scoliosis and lumbar lordosis were similar in both groups (p=0.412, 0.906, respectively). Although the number of compression fractures was similar in the two groups, the DXA measurements at fracture were more frequent in the discordance group than the concordance group (20% vs. 52.9%, p=0.015). The mean KL grade of spondylosis was 6.56±3.42 and 8.32±3.77 for the concordance and discordance groups, respectively; they were not statistically different (p=0.071). AAC-8 was significantly higher (3.11±2.99) in the discordance group than in the concordance group (1.4±2.59) (p=0.025). The Modic endplate changes were observed in four patients in the concordance group and nine patients in the discordance group without a significant difference (p=0.417). The mean facet degeneration grade of the concordance and discordance groups was 8.92±2.39 and 12.23±2.68, respectively. The difference was significant (p<0.001) (Table 3).
4. Multivariate Logistic Regression Analysis
A multivariate logistic regression model was constructed using the statistically significant risk factors between the two groups by univariate analysis. After stepwise elimination, there were two statistically significant risk factors. The highest odds ratio (OR) was observed in the measurements at fracture (OR, 4.58; 95% confidence interval [CI], 1.1-19.07). The facet degeneration grade showed a significant relationship (OR, 1.63; 95% CI, 1.23-2.15) (Table 4).
DISCUSSION
The discrepancy between the DXA and QCT was attributed to technical differences during BMD acquisition. QCT can evaluate trabecular and cortical bone independently. QCT measured BMD volumetrically and interpreted in three dimensions, whereas DXA evaluates areal bone density and reflects the amount of cortical and trabecular tissue present within a vertebrae structure. It has been reported that intra- and an interobserver compromise was outstanding in L1 density measurement by QCT. According to Gerety et al.11), there were intra-class correlation coefficients for each observer’s measurements at two separate time points with a coefficient for observer 1 of 0.94 (95% CI, 0.88-0.97) and observer 2 and 3 of 0.99 (95% CI, 0.98-1). They also presented interobserver measurements had an intra-class correlation coefficient of 0.98 (95% CI, 0.96-0.99)11). For these reasons, QCT has less impact on degenerative changes on BMD compared to DXA15).
The interruption maximizes at the lumbar spine compared to the femur. Previous studies reported that several risk factors, including spondylosis and aortic calcification, affect the areal BMD measured by DXA. On the other hand, their results were limited because prior studies relied on only plain radiographs. In contrast, the present study was conducted with additional spinal imaging results, such as CT and MRI. Therefore, an evaluation of a more detailed structural classification was possible with this study, which had never been recognized before. As a result, two novel risk factors showed a stronger relationship with the discrepancy between DXA and QCT.
Measurements at a fracture site are a form of technical error regarding the DXA outputs. After obtaining a spine bone density image, the interpreting physician should mark the ROI. According to the guideline, the region should include the inferior portion of T12 and the superior portion of L54). Setting the ROI, the physician easily excludes the area with artificial devices, such as augmenting cement and spinal instrumentation. Detecting and excluding fracture sites are inconvenient using only an unclear anteroposterior bone density scan. As a result, fracture sites are often included in ROI at DXA examination in clinical practice. The present study showed that the inclusion of the fracture sites in the ROI resulted in a powerful misinterpretation of DXA. This would have resulted from the DXA calculation using the areal BMD. The condensed bony structure by a compression fracture may lead to an overestimation of the BMD because a wedging deformity cannot be detected in two-dimensional images. Therefore, the interpreting physician needs to confirm the presence of a wedging deformity with a lateral plain radiograph if possible.
According to Yu et al.39), lumbar degenerative changes were found in all 114 patients in a group whose BMD was overestimated at the DXA examination, but they focused only on the anterior spinal column. One study reported a significant increase in BMD in subjects with vertebral osteophytes. In contrast, Reid et al.32) reported that-spinal osteophytes are unlikely to interfere with the BMD estimation, which is similar to the results of the present study. In this study, the discordance group showed a higher KL grade of spondylosis, which evaluates the degenerative changes in the vertebral osteophytes, but the difference failed to reach statistical significance. On the other hand, facet degeneration grade was a significant factor affecting the measurements from DXA. In previous papers, it has not been reported intensively whether facet joint hypertrophy has a greater effect on overestimated BMD at the DXA examination. The facet degeneration grade by Weishaupt et al.38) also concentrat ed on the narrowing of joint space and sclerosis. Nevertheless, the most significant change by a higher grade would be hypertrophy of the facet joint. Facet joint hypertrophy appears to be in proportion to the volumetric increase in the total bony structures9).
The positional relationship during DXA scanning was evaluated by the presence of scoliosis and lumbar lordosis. None of these two factors showed a significant difference between the concordance and discordance groups. On the other hand, these results do not mean that the position is irrelevant in an examination. The technician is required to confirm whether the patient has a straightforward position. The result cannot be compared if the patient had a different position on repetitive scans from the baseline study.
AAC also influences the BMD result because DXA scanning cannot distinguish between a pure vertebral structure and calcification within an adjacent blood vessel21). In this study, AAC showed a significant difference between the two groups but failed to improve the significance in multivariate analysis. Li et al.23) reported that 41/140 patients (29.3%) were diagnosed with osteoporosis only by QCT, not by DXA. A relatively large proportion of patients (25 patients, 61.0%) were found to have AAC. AAC also acts as an important independent determinant of cardiovascular disease35). A previous study reported that the severity of aortic calcifications was negatively correlated with the BMD results at the lumbar spine27).
Two patients were diagnosed with osteoporosis on DXA but osteopenia on QCT. They were included in the concordance group in this study. They consisted of one male and one female. They had relatively short stature (male, 164 cm; BMI, 24.72; female, 149 cm; BMI, 19.82). There has been a report that a short stature can be associated with an inaccurate measurement of bone mass34). The female patient was on the treatment of osteoporosis with denosumab. It is reported that desunomab reduces cortical porosity and increases the volume ratio of trabecular bone to total bone volume40). Although underestimation of DXA could be caused by changes in the proportion of cortical bone depending on the drug and medical condition, the exact cause of underestimation of DXA was unclear in these two patients.
This study had several limitations. This research had a retrospective design with a relatively small sample size. Furthermore, because this study was conducted in a single institution, the results might have been affected by the distinct characteristics of the area. A multi-center study with a larger number of patients from diverse regions will be needed to decrease the possibility of bias.
CONCLUSION
QCT showed a higher detection rate of osteoporosis than DXA. DXA might miss a diagnosis of osteoporosis. Facet joint hypertrophy due to degeneration revealed a stronger association with the overestimation of the BMD by DXA than the formation of osteophytes at the vertebral body. The inclusion of a region-of-interest at the fracture site, which is a common technical error, also resulted in the incorrect measurement of osteoporosis by DXA. Therefore, the results of DXA should be interpreted carefully.